
Platform
Telegraf
How to configure Telegraf to send data to Last9 using the Prometheus Remote Write feature
Telegraf is an open-source agent that collects metrics and data from various sources and sends them to other services, such as InfluxDB, Graphite, and Prometheus. This document describes how Telegraf can integrate with Last9.
Last9 accepts remote write metrics in Prometheus / OpenTelemetry format. Telegraf supports both push-based and pull-based methods for these formats.
Pre-requisites
- You have created a Last9 cluster by following the getting started guide
- Clone last9-integrations GitHub repository contains the sample code with different approaches discussed in this article
Push via vmagent (recommended)
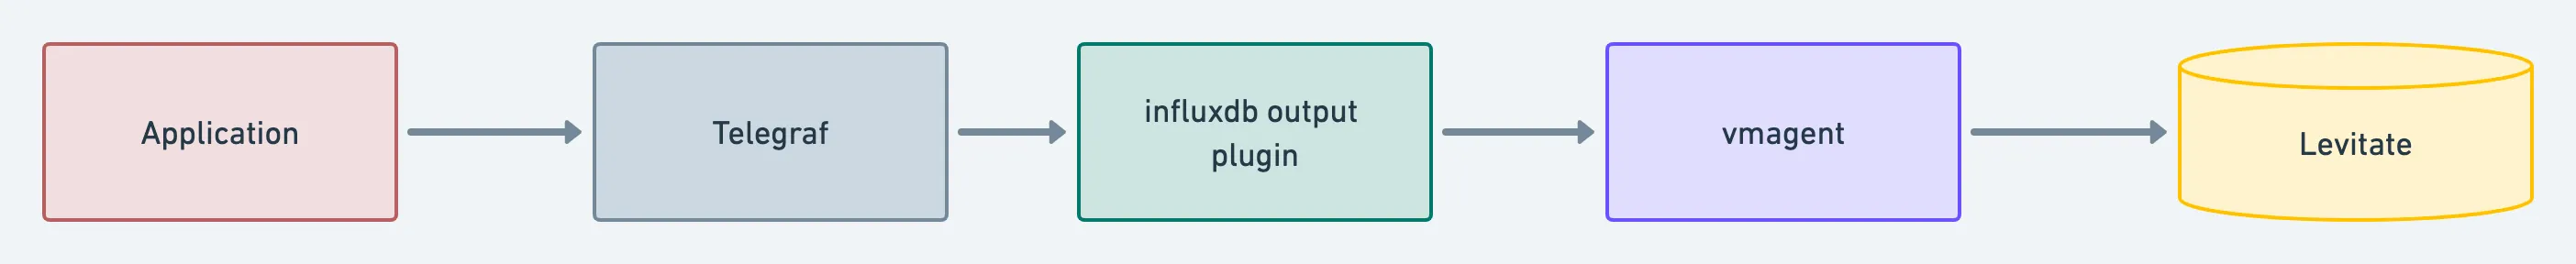
- A sample application sends metrics to
telegraf telegrafhas an InfluxDB output plugin, which send metrics tovmagentvmagentaccepts InfluxDB format as input and outputs Prometheus format metrics to Last9
You can configure the vmagent URL as follows in the telegraf config file.
################################################################################ OUTPUTS ################################################################################[[outputs.influxdb]] urls = ["http://vmagent:8429"]A working sample application can be found here.
This is the recommended approach for pushing metrics from Telegraf to Last9.
Push via Prometheus Remote Write plugin
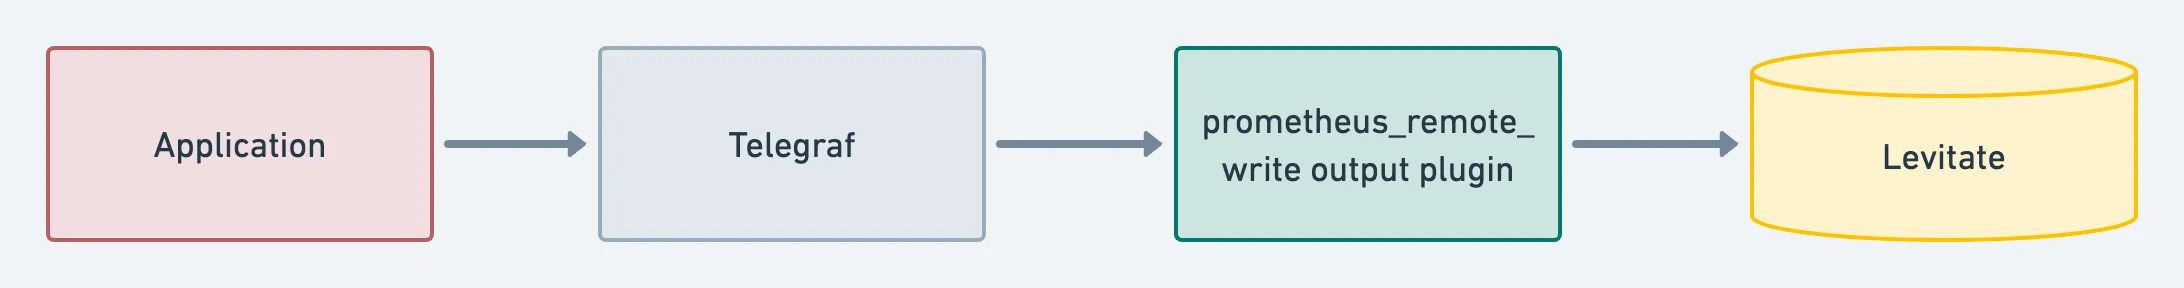
- A sample application sends metrics to
telegraf telegrafhas an HTTP output plugin, which supportsprometheusremotewriteformat to convert input metrics to Prometheus protobuf format and push them to Last9
The changes to the telegraf config are as follows:
## Data format to output.  data_format = "prometheusremotewrite"
  ## Additional HTTP headers  [outputs.http.headers]     Content-Type = "application/x-protobuf"     Content-Encoding = "snappy"     X-Prometheus-Remote-Write-Version = "0.1.0"
Here is a sample application with this setup.
Pull via Prometheus Client plugin
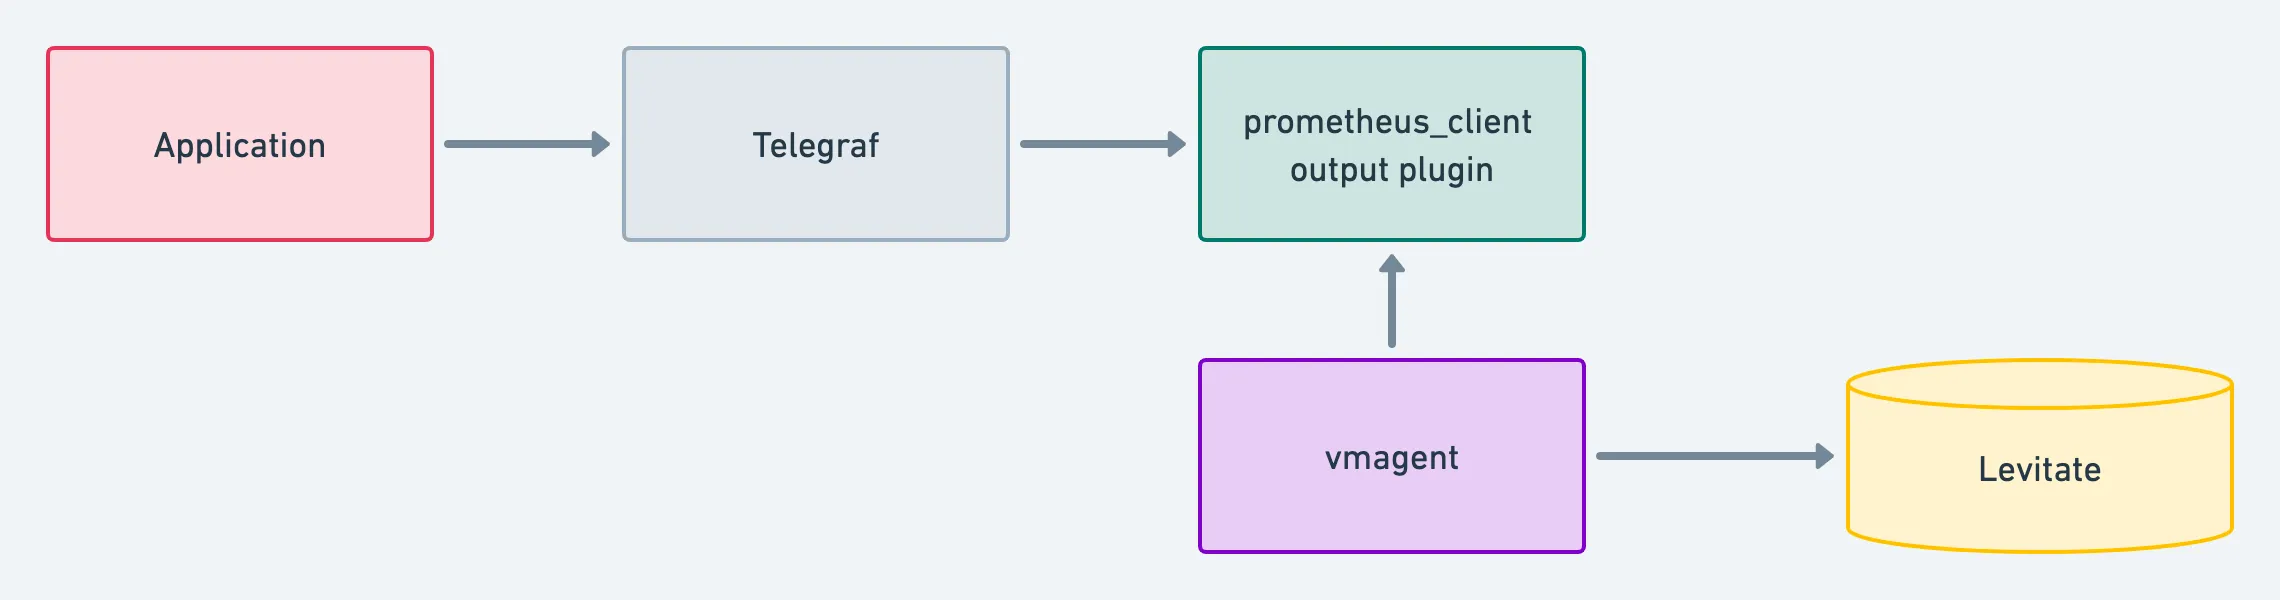
- A sample application sends metrics to
telegraf telegrafhas a Prometheus output plugin, which exposes all input metrics on/metricsurl- These metrics are scraped by
vmagentwhich remote writes to Last9
This approach also requires a change in the outputs section in the telegraf config as follows. The 9273 port is used in the vmagent config file which scrapes it for metrics.
################################################################################                                  OUTPUTS                                    ################################################################################
# Configuration for the Prometheus client to spawn[[outputs.prometheus_client]]  ## Address to listen on.  listen = ":9273"
A complete example using this approach can be found here.
Comparison
| Approach | Pros | Cons |
|---|---|---|
| Push via vmagent | Transparent relay from Telegraf to InfluxDB format to Last9. | None |
| Push via Prometheus remote write | No need to run any additional scraping agent because of the direct push model. | Histogram-based metrics might be impacted if Telegraf pushes partial results in one chunk. This has been mentioned in prometheusremotewrite plugin docs. |
| Pull via Client plugin | Metrics are shipped to Last9 using the standard scrape model. | It has an overhead to run vmagent or any other scraping tool additionally. |
Next steps
Create a read token for your Last9 Cluster and follow our guide to Configure Grafana to visualize the time series data getting sent to Last9.
Troubleshooting
Please get in touch with us on Discord or Email if you have any questions.