
Platform
Monitor RabbitMQ using Last9
Send RabbitMQ metrics to Last9
This document lists step-by-step instructions for setting up monitoring for RabbitMQ using Last9.
Prerequisites
Create a Last9 cluster by following Getting Started.
Keep the following information handy after creating the cluster:
$levitate_read_url- Last9’s Read endpoint$levitate_username- Cluster ID$levitate_password- Read token created for the cluster
Ensure RabbitMQ is installed and running on each VM. You should have root or administrative access.
Ensure that rabbitmq_prometheus plugin is configured as per its documentation.
Configure Prometheus Agent to Scrape Metrics
Architecture
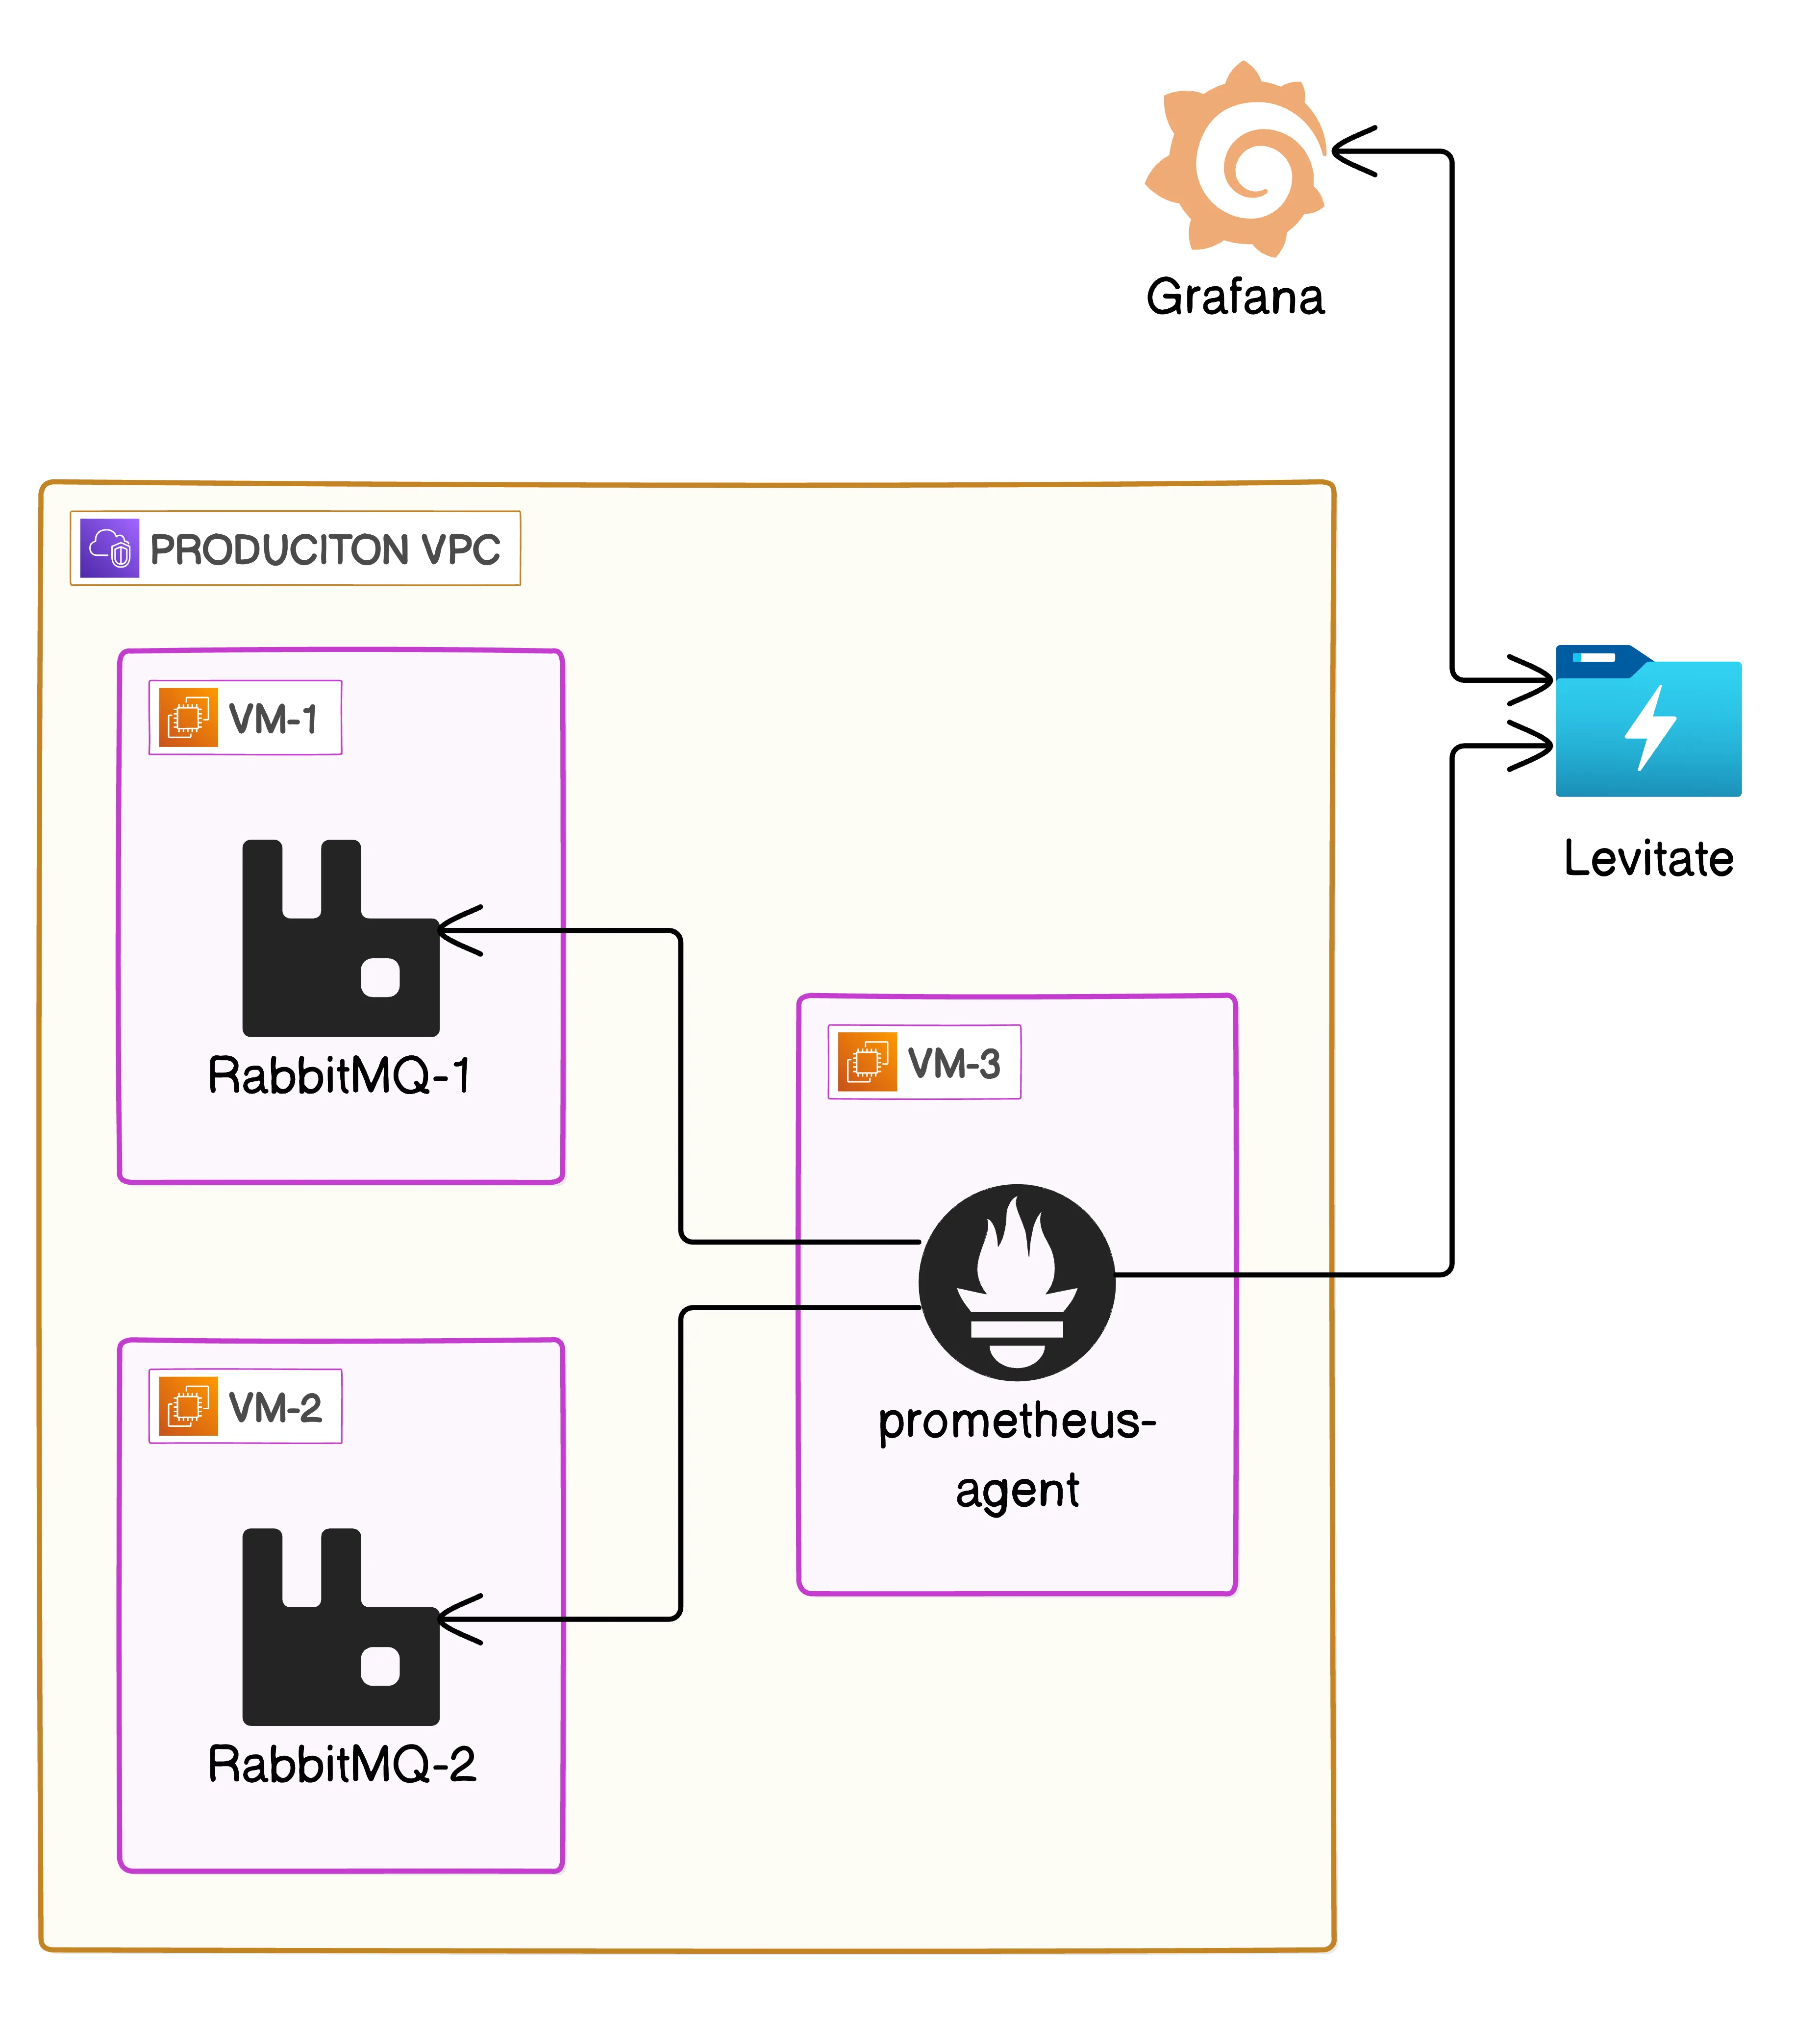
Setting up Prometheus Agent
Install Prometheus Agent on a central server that can access all VMs running RabbitMQ. This script can be run on the server:
#!/bin/bash
# Function to determine OS architectureget_architecture() {    architecture=$(uname -m)    case $architecture in        x86_64)            arch="amd64"            ;;        aarch64)            arch="arm64"            ;;        arm*)            arch="armv7"            ;;        *)            echo "Architecture $architecture is not supported by this script."            exit 1            ;;    esac    echo $arch}
# Define version and architectureVERSION="2.37.0"ARCH=$(get_architecture)
# Download and install Prometheus AgentURL="https://github.com/prometheus/prometheus/releases/download/v$VERSION/prometheus-$VERSION.linux-$ARCH.tar.gz"wget $URL -O prometheus.tar.gztar -xzf prometheus.tar.gzcd prometheus-$VERSION.linux-$ARCH
# Move executables to your PATHsudo mv prometheus promtool /usr/local/bin/sudo mkdir /etc/prometheussudo mkdir -p /var/lib/prometheussudo mv consoles/ console_libraries/ prometheus.yml /etc/prometheus/
# Create a service file for Prometheusecho "[Unit]Description=PrometheusWants=network-online.targetAfter=network-online.target
[Service]User=$USERRestart=on-failureExecStart=/usr/local/bin/prometheus \\    --config.file=/etc/prometheus/prometheus.yml \\    --enable-feature=agent
[Install]WantedBy=multi-user.target" | sudo tee /etc/systemd/system/prometheus.service
# Reload systemd to pick up the new service and start Prometheus Agentsudo systemctl daemon-reloadsudo systemctl start prometheussudo systemctl enable prometheus
Configure Scrape Targets
Use either ec2_sd_config or file_sd_config to configure scrape targets. The example uses file_sd_config for simplicity.
Create a file targets.json and add the following:
Ensure that the targets are the Private IPs of the RabbitMQ cluster or instances.
[ { "targets": ["rbmq-vm-1:15692", "rbmq-vm-1:15692"], "labels": { "job": "rabbitmq" } }]Configure Last9 Remote Write Credentials into Prometheus Agent
Add the following remote_write configuration to the prometheus.yml file:
echo "remote_write: - url: "$remote_write_url" basic_auth: username: "$remote_write_username" password: "$remote_write_password" write_relabel_configs: - source_labels: [__name__] regex: 'rabbitmq_(.*)'" | sudo tee -a /etc/prometheus/prometheus.yReplace remote_write_* template variables with your Last9 Credentials that can be obtained by following this documentation
Restart Prometheus Agent
Restart Prometheus Agent to apply changes:
sudo systemctl restart prometheusVerification
- Check Prometheus Agent’
/targetsand/graphweb interfaces to ensure it’s scraping the RabbitMQ metrics - Verify that metrics are being received in the remote storage
This script-driven setup automates the deployment and configuration of RabbitMQ monitoring using Prometheus Agent.
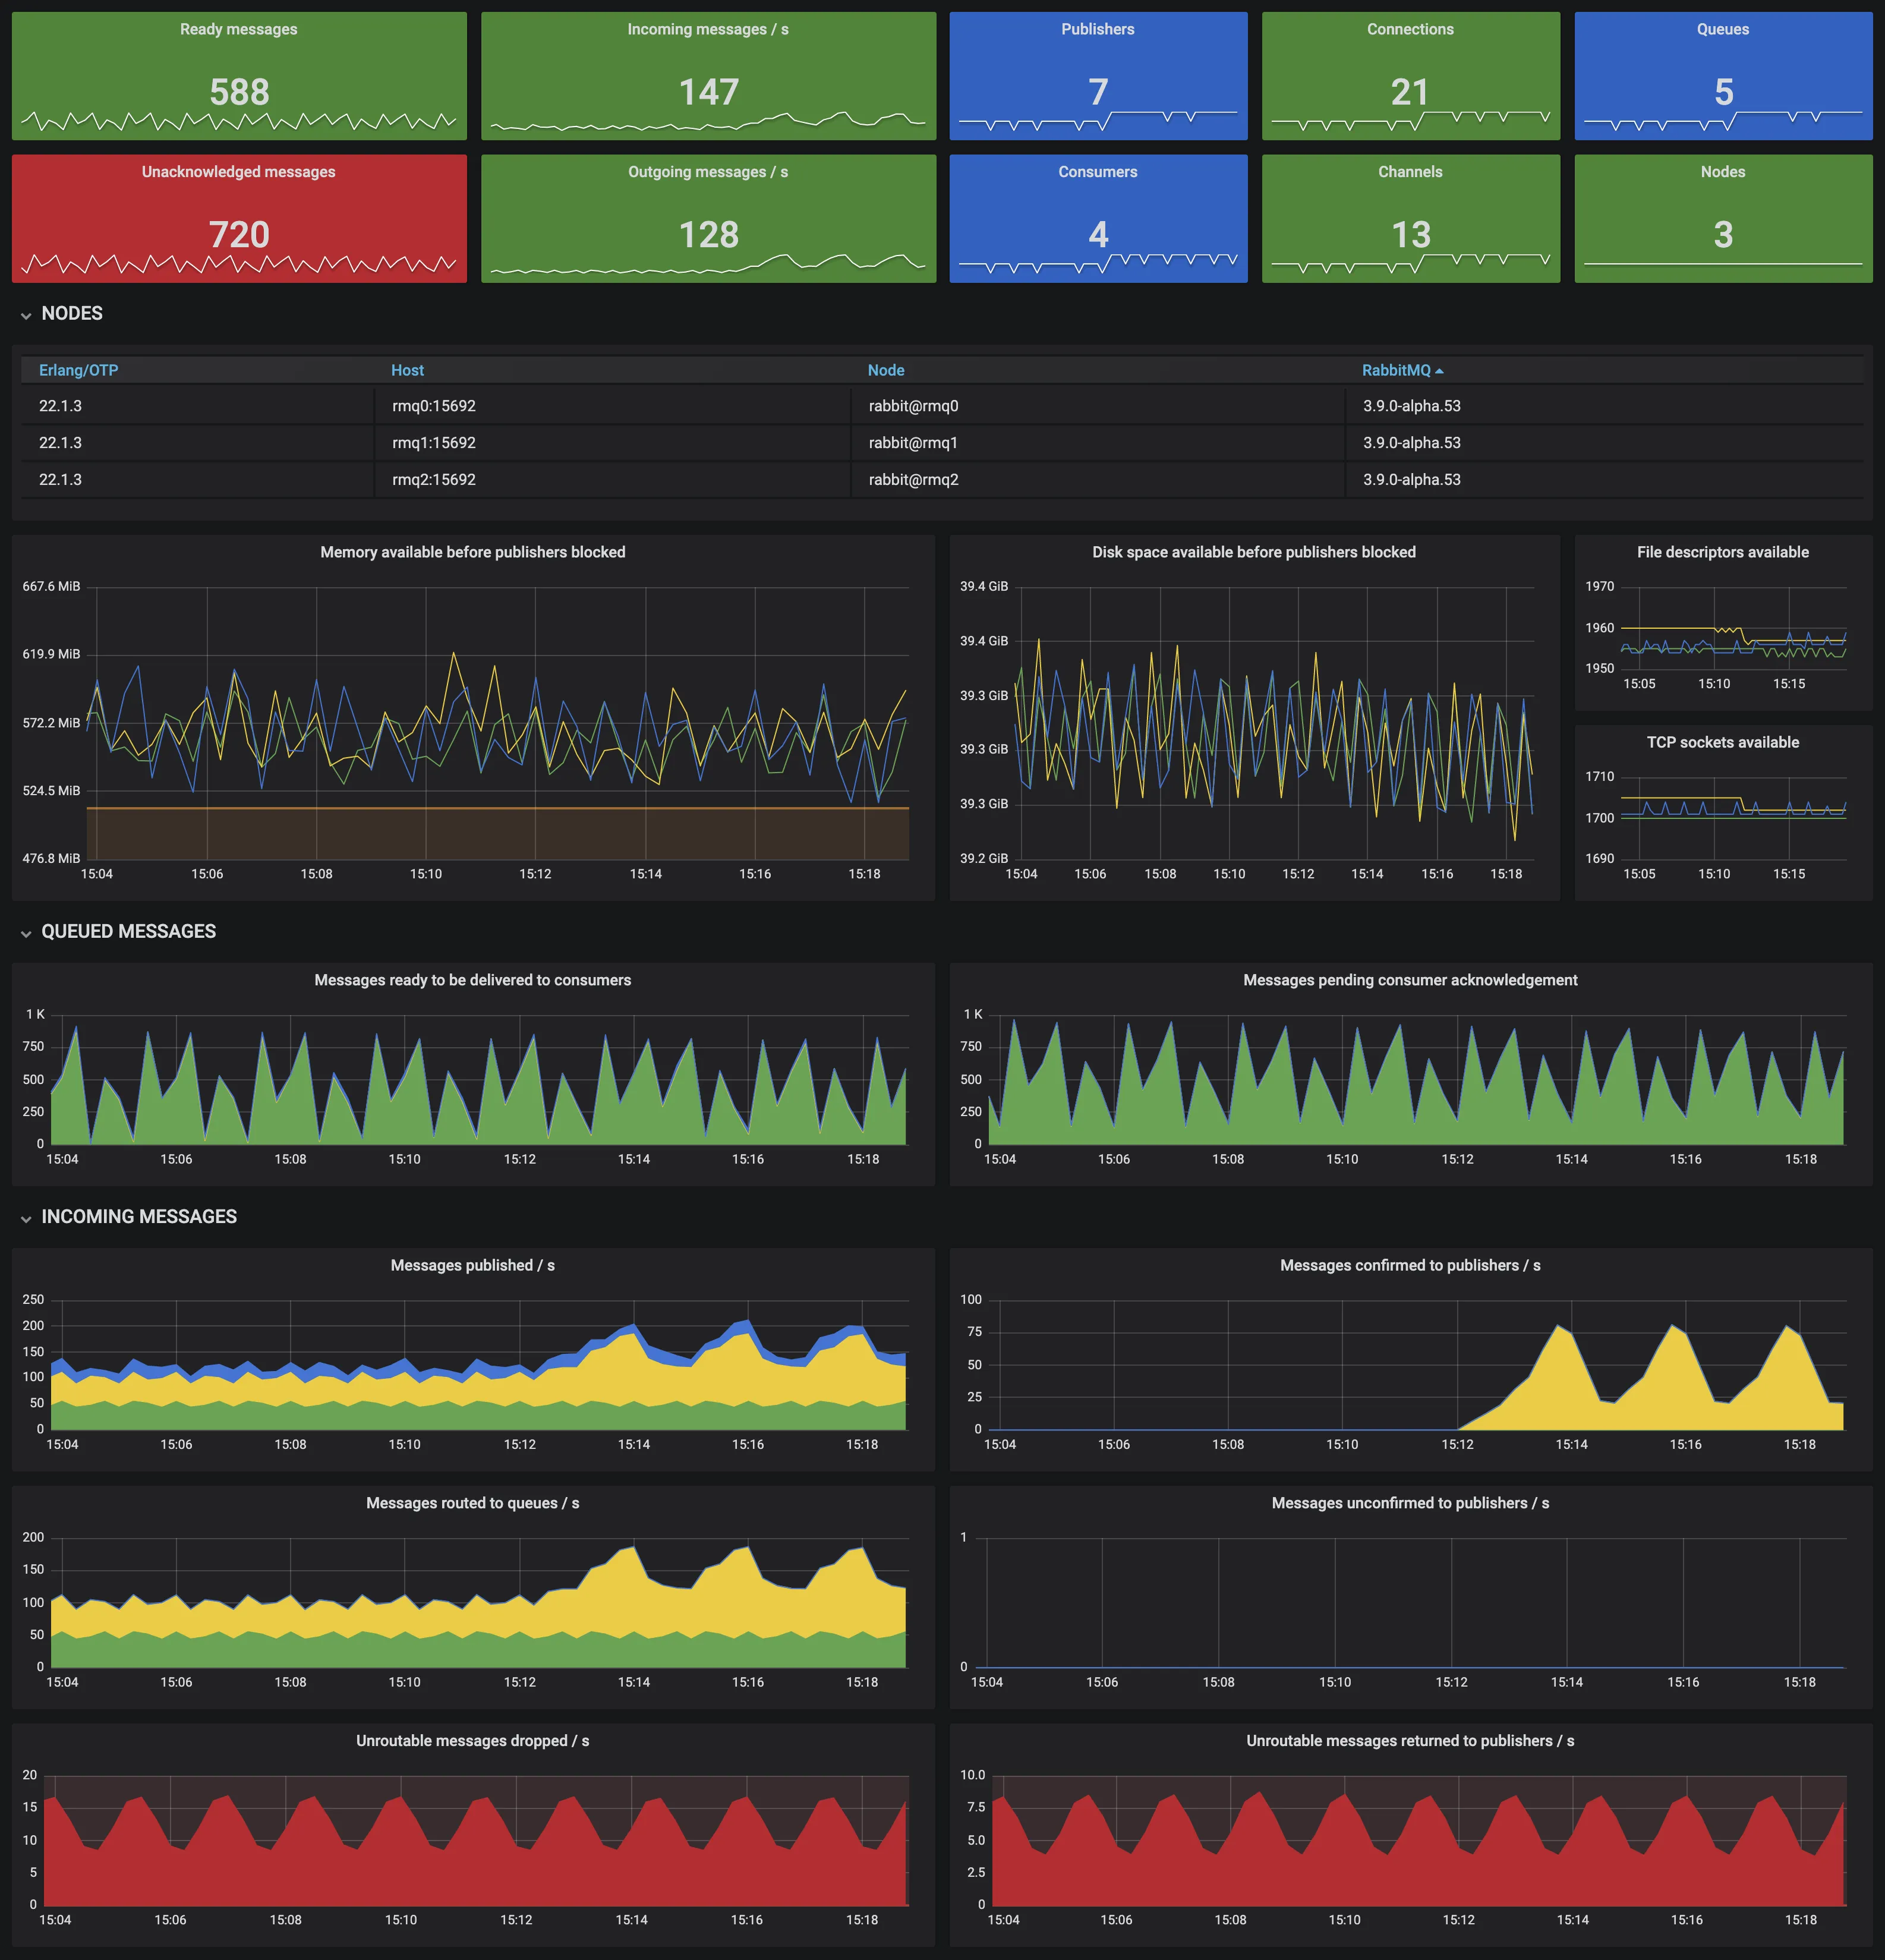
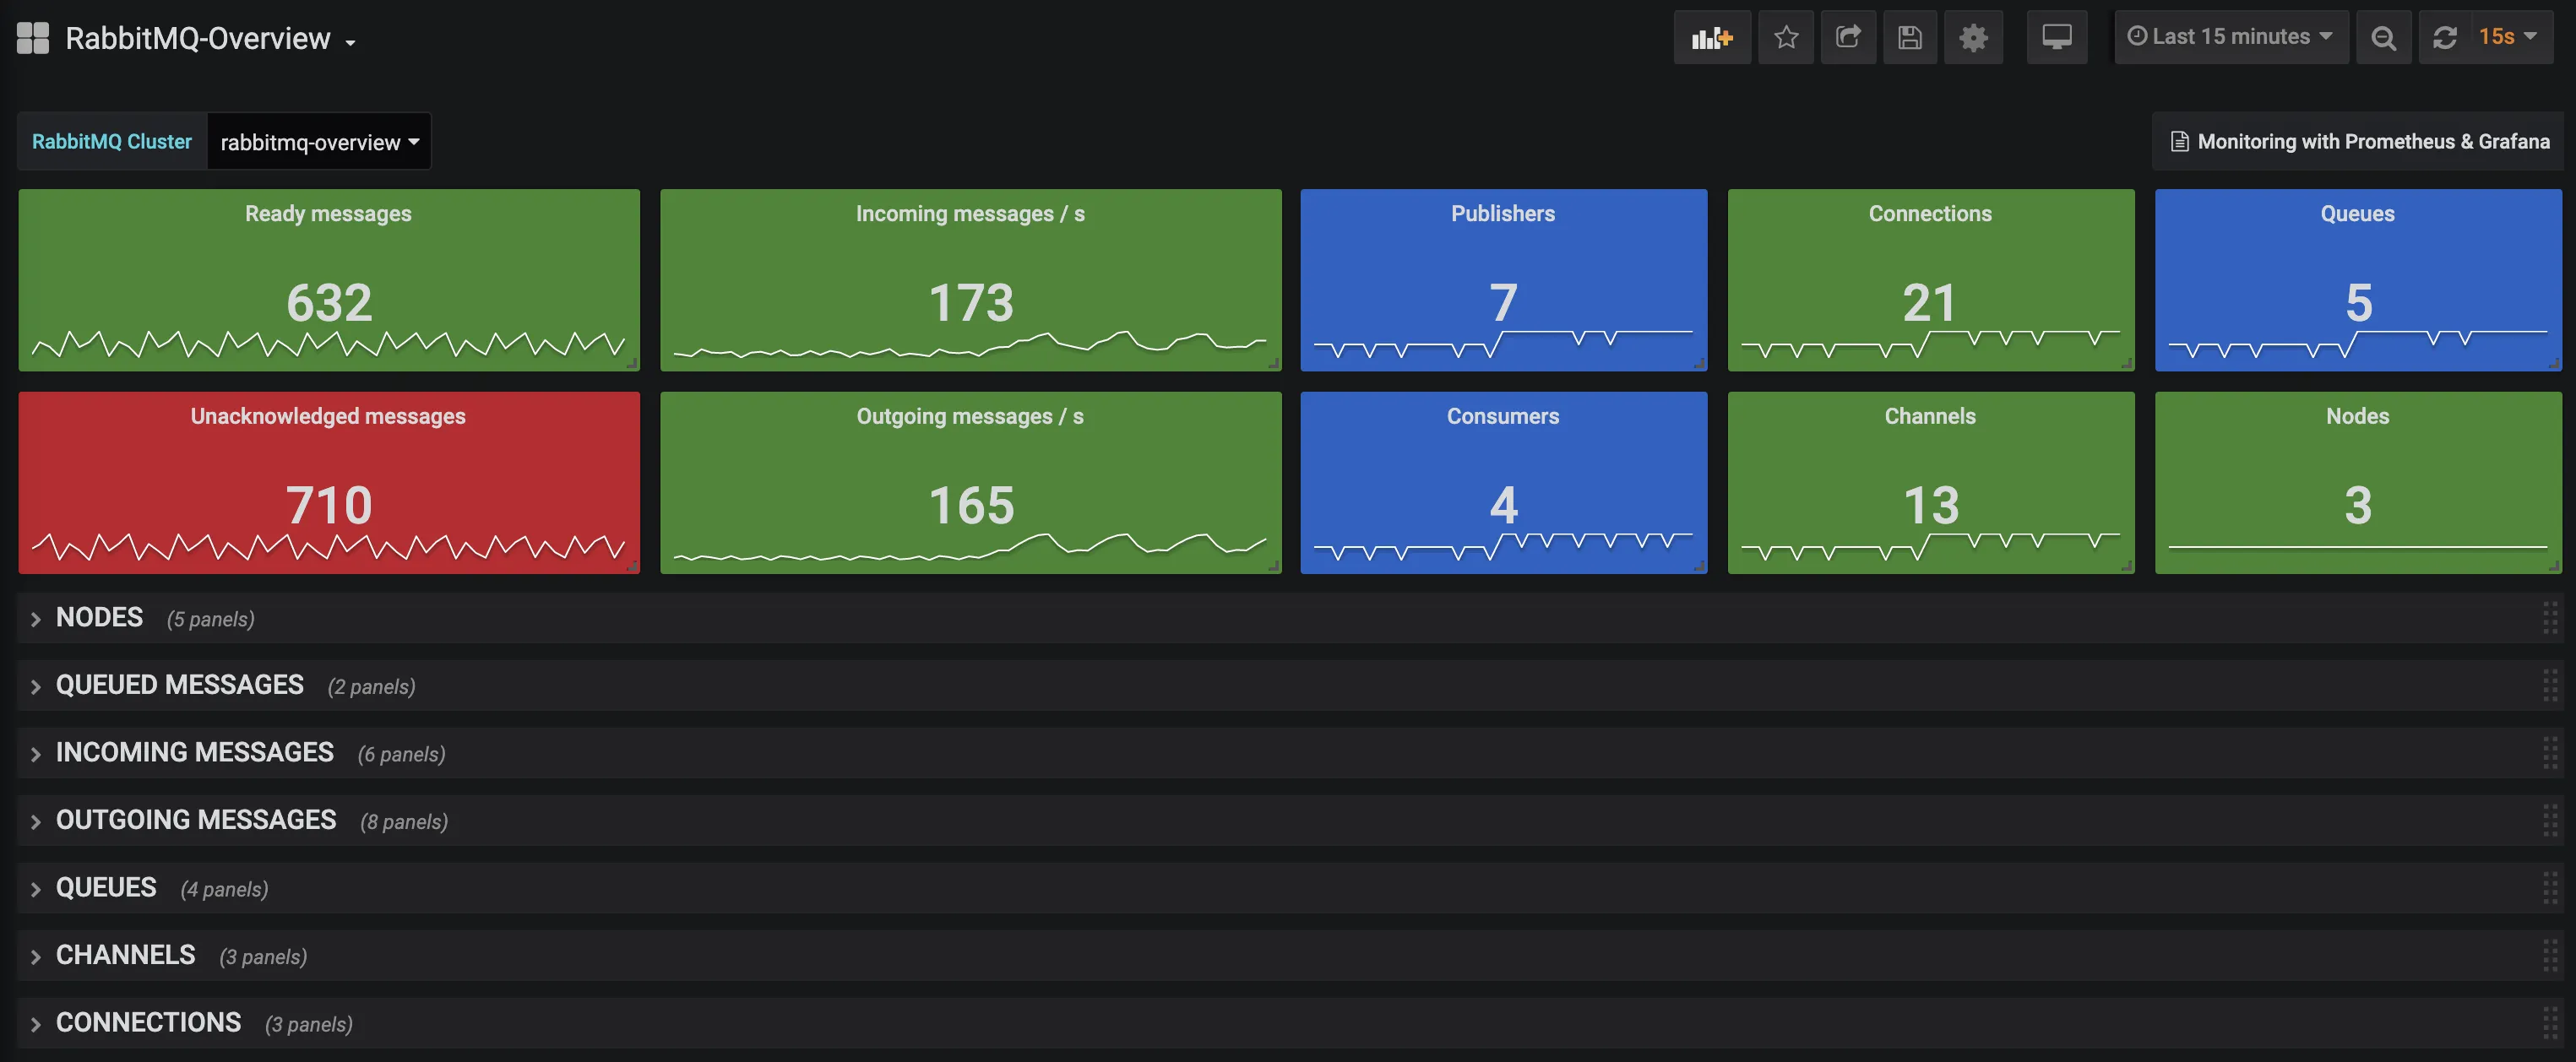
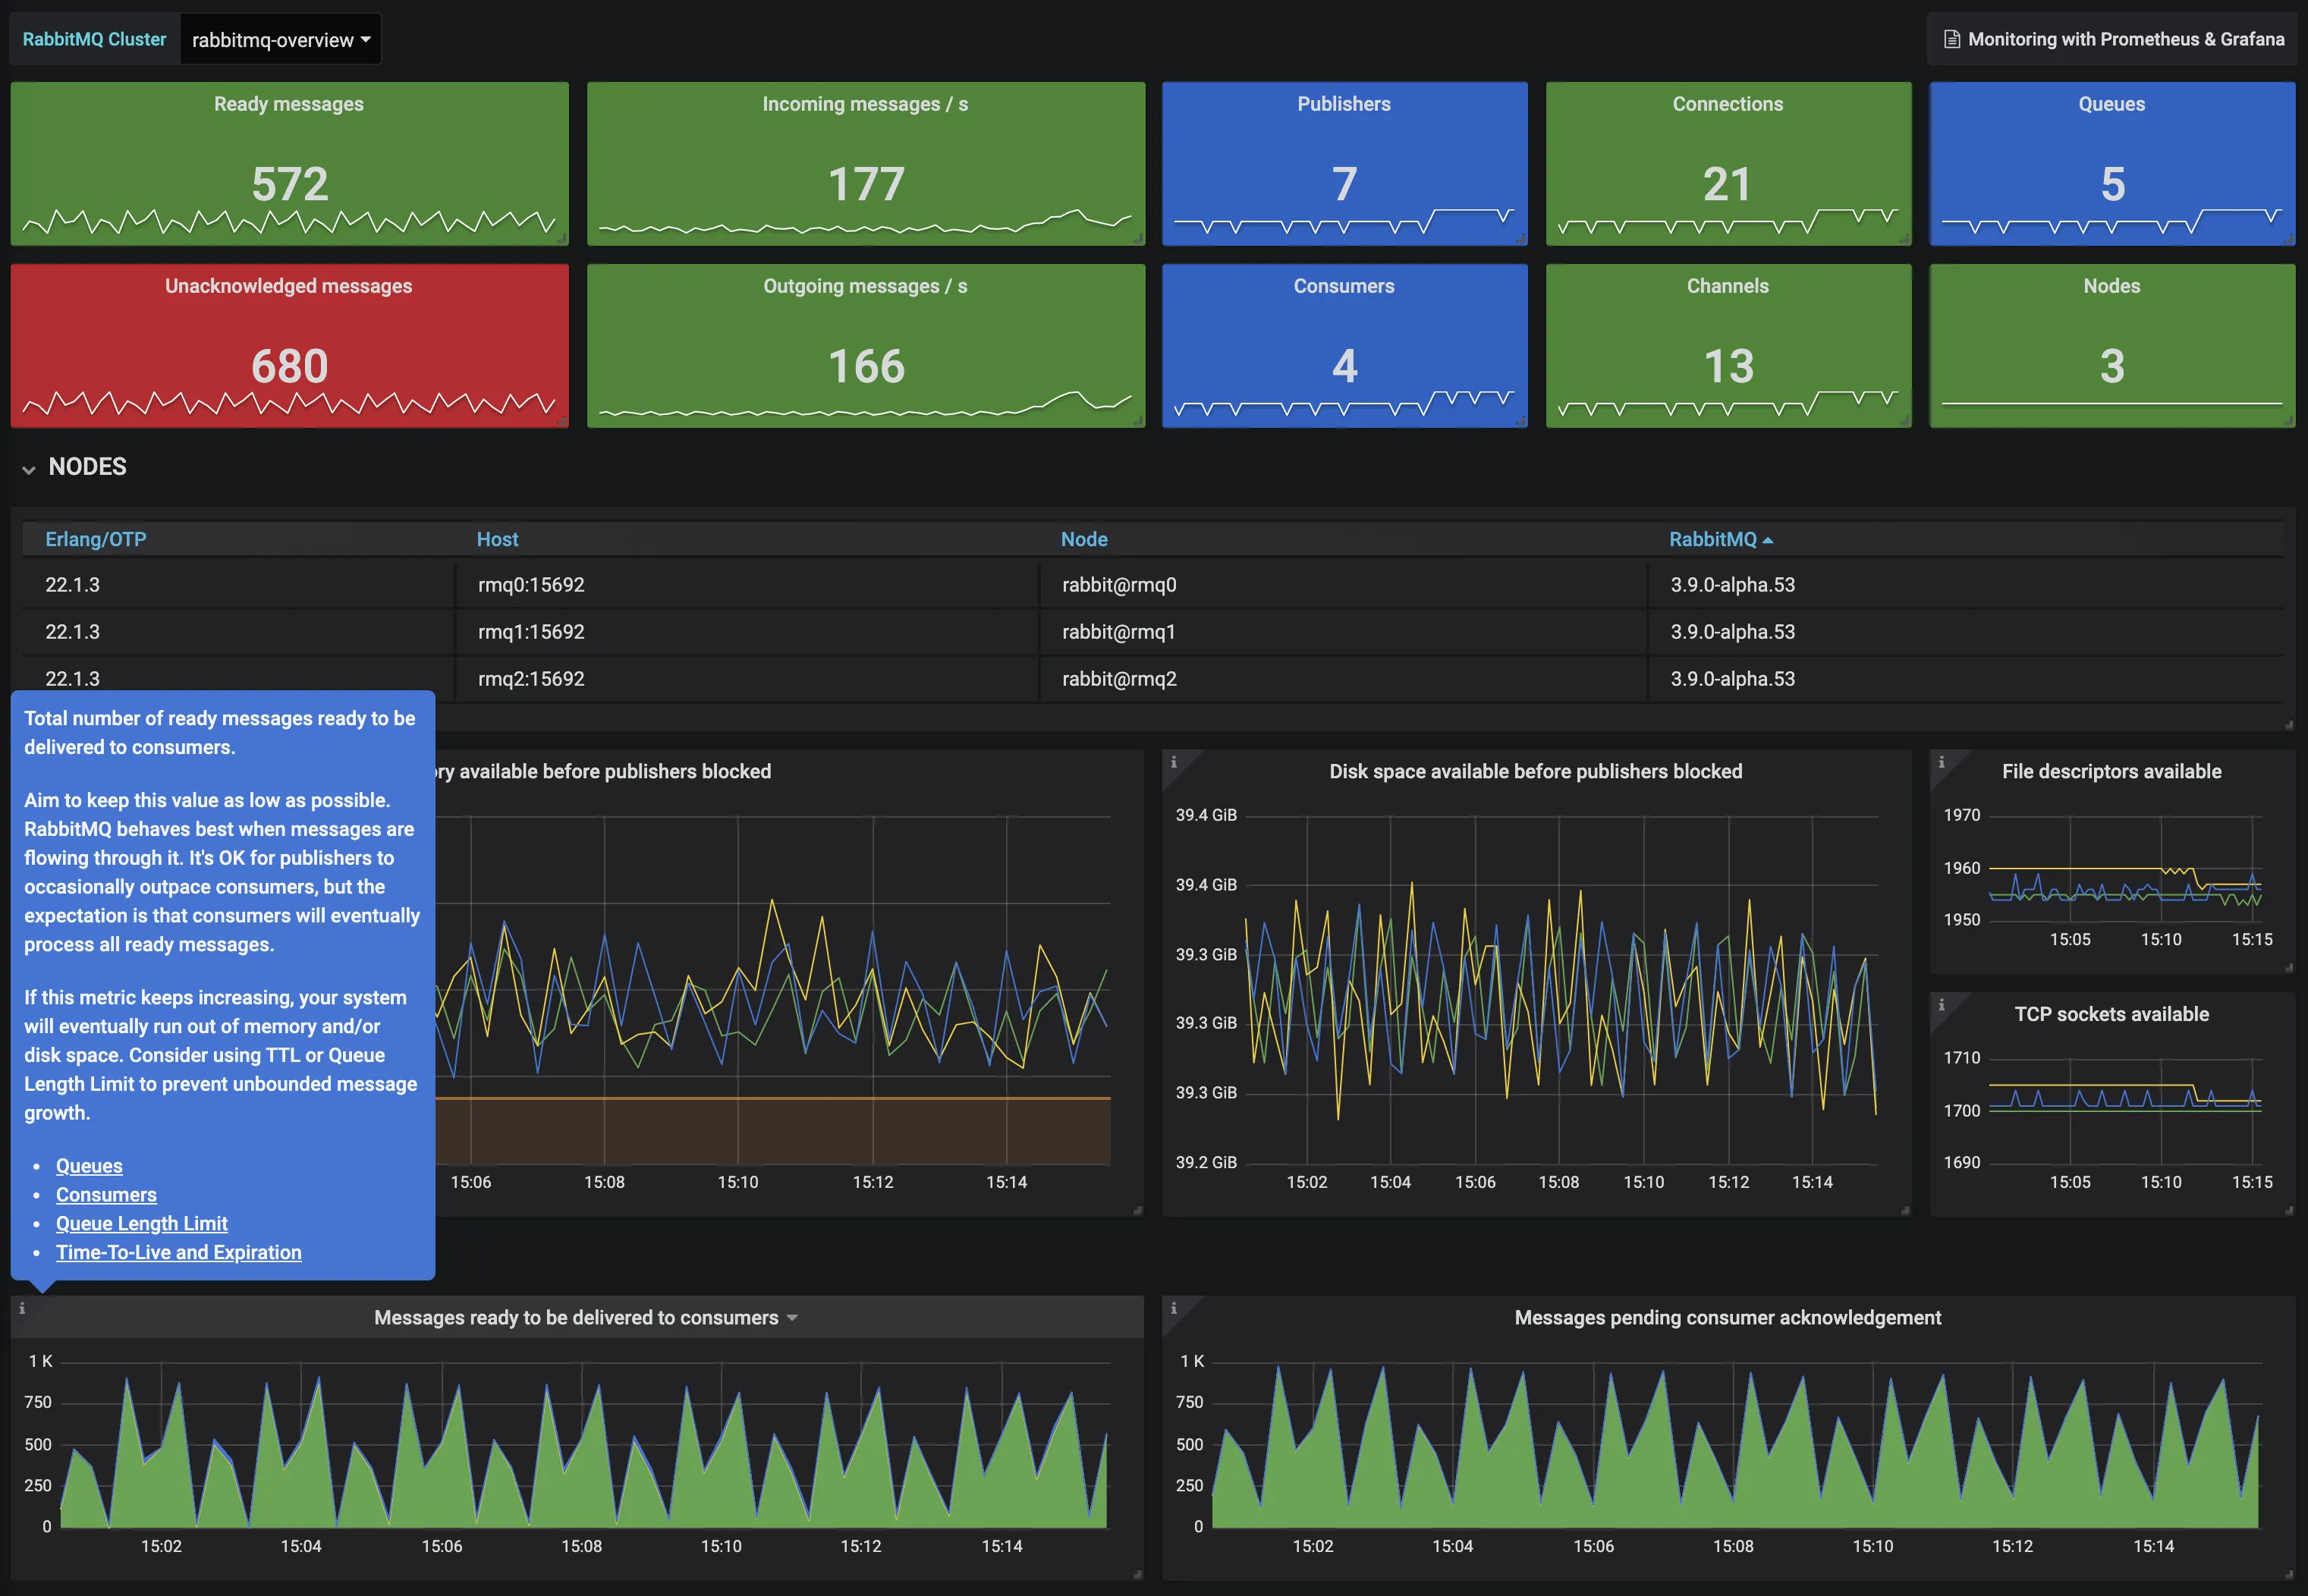
Dashboard
Download the latest dashboard from here to visualize the metrics.
Troubleshooting
Please get in touch with us on Discord or Email if you have any questions.