Prometheus has become a cornerstone of modern observability stacks, particularly in cloud-native environments. As organizations scale their infrastructure, the ability to efficiently store and query long-term metrics becomes crucial. This is where Prometheus remote write shines, allowing you to send metrics to external storage systems for long-term retention and analysis.
However, as your metrics volume grows, you may encounter performance bottlenecks in your remote write pipeline. This guide will walk you through various strategies to optimize your Prometheus remote write performance, ensuring your monitoring system scales alongside your infrastructure.
Understanding Remote Write Performance Bottlenecks
Before diving into optimization techniques, it's essential to understand common performance issues and the factors that affect remote write performance.
Common Performance Issues:
- High CPU and memory usage on Prometheus servers
- Increased network bandwidth consumption
- Growing remote write queues
- Delays in metric availability in remote storage
Factors Affecting Performance:
- Volume of metrics being collected
- Cardinality of time series
- Network latency and reliability
- Remote storage write capacity
- Prometheus server resources (CPU, memory, disk I/O)
Key Metrics to Monitor:
prometheus_remote_storage_samples_in_totalprometheus_remote_storage_samples_dropped_totalprometheus_remote_storage_queue_lengthprometheus_remote_storage_sent_batch_duration_seconds
Queue Configuration Optimization
The remote write queue acts as a buffer between Prometheus and your remote storage (example: Last9). Proper queue configuration is crucial for smooth operation.
Key Queue Parameters:
capacity: Maximum number of samples in the queuemax_samples_per_send: Maximum number of samples per requestbatch_send_deadline: Maximum time samples will wait in the queuemin_shardsandmax_shards: Control concurrency of remote write
Best Practices:
- Start with conservative values and adjust based on observed performance
- Increase
capacityfor larger buffers, but be mindful of memory usage - Adjust
max_samples_per_sendbased on your network and remote storage capabilities - Set
batch_send_deadlineto balance between latency and efficiency
Example configuration:
remote_write:
  - url: 'http://remote-write-endpoint'
    queue_config:
      capacity: 100000
      max_samples_per_send: 10000
      batch_send_deadline: 5s
      min_shards: 1
      max_shards: 10
Data Cardinality Management
High cardinality can severely impact remote write performance. Each unique combination of labels creates a new time series, potentially leading to millions of series.
Strategies for Reducing Cardinality:
- Review and refine your labeling strategy
- Use recording rules to pre-aggregate high cardinality metrics
- Implement a cardinality limiter in your Prometheus configuration
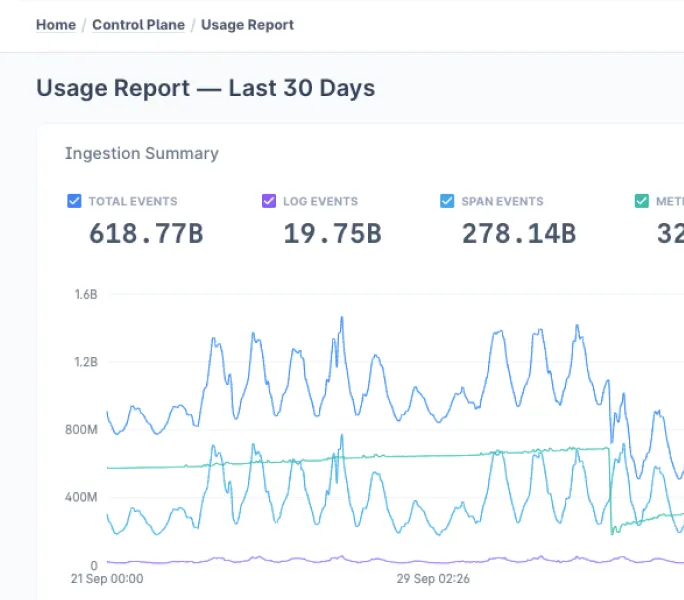
- Use Last9 Control plane to not change instrumentation and make run time changes.
Example Recording Rule:
groups:
  - name: example
    rules:
      - record: job:http_requests_total:sum
        expr: sum(http_requests_total) by (job)
This rule pre-aggregates the http_requests_total metric by job, reducing cardinality.
Effective Use of Relabeling
Relabeling allows you to modify labels before metrics are sent to remote storage, helping to reduce data volume and cardinality.
Relabeling Strategies:
- Drop unnecessary metrics
- Remove high-cardinality labels
- Aggregate metrics at ingestion time
Example configuration:
remote_write:
  - url: 'http://remote-write-endpoint'
    write_relabel_configs:
      - source_labels: [__name__]
        regex: 'temp.*'
        action: drop
      - regex: '(id|uuid)'
        action: labeldrop
This configuration drops all metrics starting with "temp" and removes the "id" and "uuid" labels from all metrics.
Network and Data Transfer Optimization
Efficient data transfer is crucial for remote write performance, especially when dealing with high-latency or unreliable networks.
Optimization Techniques:
- Enable compression
- Use persistent connections
- Implement retry mechanisms with exponential backoff
Example configuration with compression:
remote_write:
  - url: 'http://remote-write-endpoint'
    remote_timeout: 30s
    compression: snappy
Remote Storage Considerations
The choice of remote storage can significantly impact your remote write performance.
Factors to Consider:
- Write throughput capacity
- Query performance
- Data retention policies
- Scalability and operational complexity
Popular remote storage options include Thanos, Cortex, Last9 and VictoriaMetrics. Each has its strengths and trade-offs, so choose based on your specific requirements.
Monitoring and Troubleshooting Remote Write
Proactive monitoring of your remote write pipeline is essential for maintaining performance.
Key Metrics to Watch:
prometheus_remote_storage_samples_in_totalprometheus_remote_storage_samples_dropped_totalprometheus_remote_storage_queue_lengthprometheus_remote_storage_sent_batch_duration_seconds
Set up alerts for abnormal values in these metrics to catch issues early.
Troubleshooting Tips:
- Check Prometheus logs for error messages
- Verify network connectivity to the remote endpoint
- Analyze remote write metrics for bottlenecks
- Review recent configuration changes
Case Study: Optimizing Remote Write at Scale
At Last9, we worked with a client who was struggling with remote write performance as their infrastructure grew to over 10,000 nodes. Here's how we optimized their setup:
- Implemented relabeling to reduce cardinality through the Last9 control plane
- Set up streaming aggregation to pre-aggregate high-cardinalitythe metrics
- Tuned queue settings based on observed traffic patterns
Results:
- 60% reduction in remote write CPU usage
- 45% decrease in network bandwidth consumption
- 70% improvement in remote write latency
Best Practices and Future Considerations
As you optimize your Prometheus remote write setup, keep these best practices in mind:
- Start with conservative settings and adjust gradually
- Regularly review and refine your labeling strategy
- Monitor remote write performance continuously
- Keep your Prometheus version updated to benefit from ongoing improvements
Looking ahead, the Prometheus community is working on features like streaming remote write and improved backpressure handling, which promise to further enhance remote write performance.
Conclusion
Optimizing Prometheus remote write performance is an ongoing process that requires a deep understanding of your monitoring needs and infrastructure. By applying the techniques discussed in this guide – from queue configuration and cardinality management to effective relabeling and careful remote storage selection – you can significantly improve the efficiency and reliability of your Prometheus remote write setup.
Remember, there's no one-size-fits-all solution. Continuously monitor your system's performance, be prepared to make adjustments, and stay informed about new developments in the Prometheus ecosystem. With these strategies in hand, you'll be well-equipped to scale your monitoring infrastructure alongside your growing business needs.
If you still need to discuss some settings, jump onto the Last9 Discord Server to discuss any specifics you need help with.


