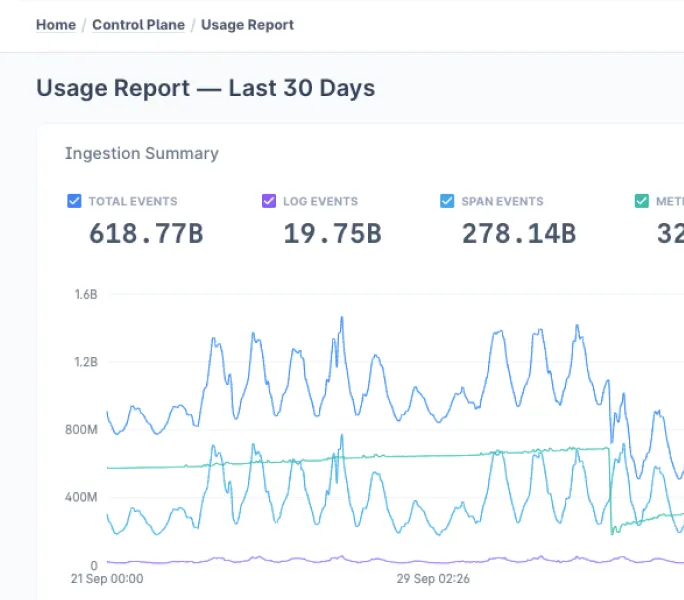

With Levitate, we’ve been building a high-cardinality monitoring tool that reduces the toil of running your own Prometheus setup. Features like streaming aggregation, run-time alert group labels and rule filters, and macros that are reusable for querying and alerting enable customers to simplify and standardize usage across teams.
As we speak with our customers, be it small teams and early-stage startups with a lone SRE or large enterprises and unicorn startups with a dedicated reliability team — everyone seems to have a recurring problem across the pipeline.
How does one standardize their monitoring journey — from instrumentation to alerting?
Today, when you’re kickstarting your monitoring journey with Prometheus, it’s not an easy place to dive into right off the bat. One has to figure out which exporter to run, but then each exporter has their own nomenclature for emitted metrics, which then need their own set of alert rules and dashboards.
At the same time, they also have to deal with a painfully broken experience of using multiple resources and tools that enable the above.
How can Last9 help?
Project APT
Can Last9 make a toolkit to ease the pain?
A popular resource that many start with is https://github.com/samber/awesome-prometheus-alerts, maintained by Samuel Berthe. It’s a repository of alert rules configurations for your Prometheus setup. It seemed like a good place for us to start with.
With the v0.1 of Awesome Prometheus Toolkit, we are setting a foundation for the developer experience we want:
- You point APT to your running Prometheus server
- APT identifies which components are sending metrics to Prometheus
- APT gives recommendations on what alert rules (sourced from https://github.com/samber/awesome-prometheus-alerts) should be applied
As of launch, APT gives you recommendations and tracks which rules are already applied for the following components:
- Clickhouse
- Elasticsearch
- HaProxy
- Kubernetes
- Nginx
- PostgreSQL
Get Started
- Go to awesome-prometheus-toolkit and clone the repo locally
- Run
npm installto install the dependencies - Run
npm run devto run the dev server - Open
localhost:3000in your browser - Enter the URL of your local/test/production Prometheus server, and click Connect
- You can also set the auth, if your server requires it
- Once APT identifies the supported components in your emitted metrics, you can view the recommendations. You can simply copy the recommended rules and apply them in your Prometheus’
rules.yml - If you have any additional components, you can also use the Browse Library section to find and copy those rules
If you don’t have a Prometheus server handy but still want to play around with APT, you can also use the demo setup provided in the repo to generate Nginx metrics.
- Run
cd promtheus-server - Run
docker compose upto start the local server - Use
localhost:9090as the source URL on the APT home screen, without any required auth
What’s Next
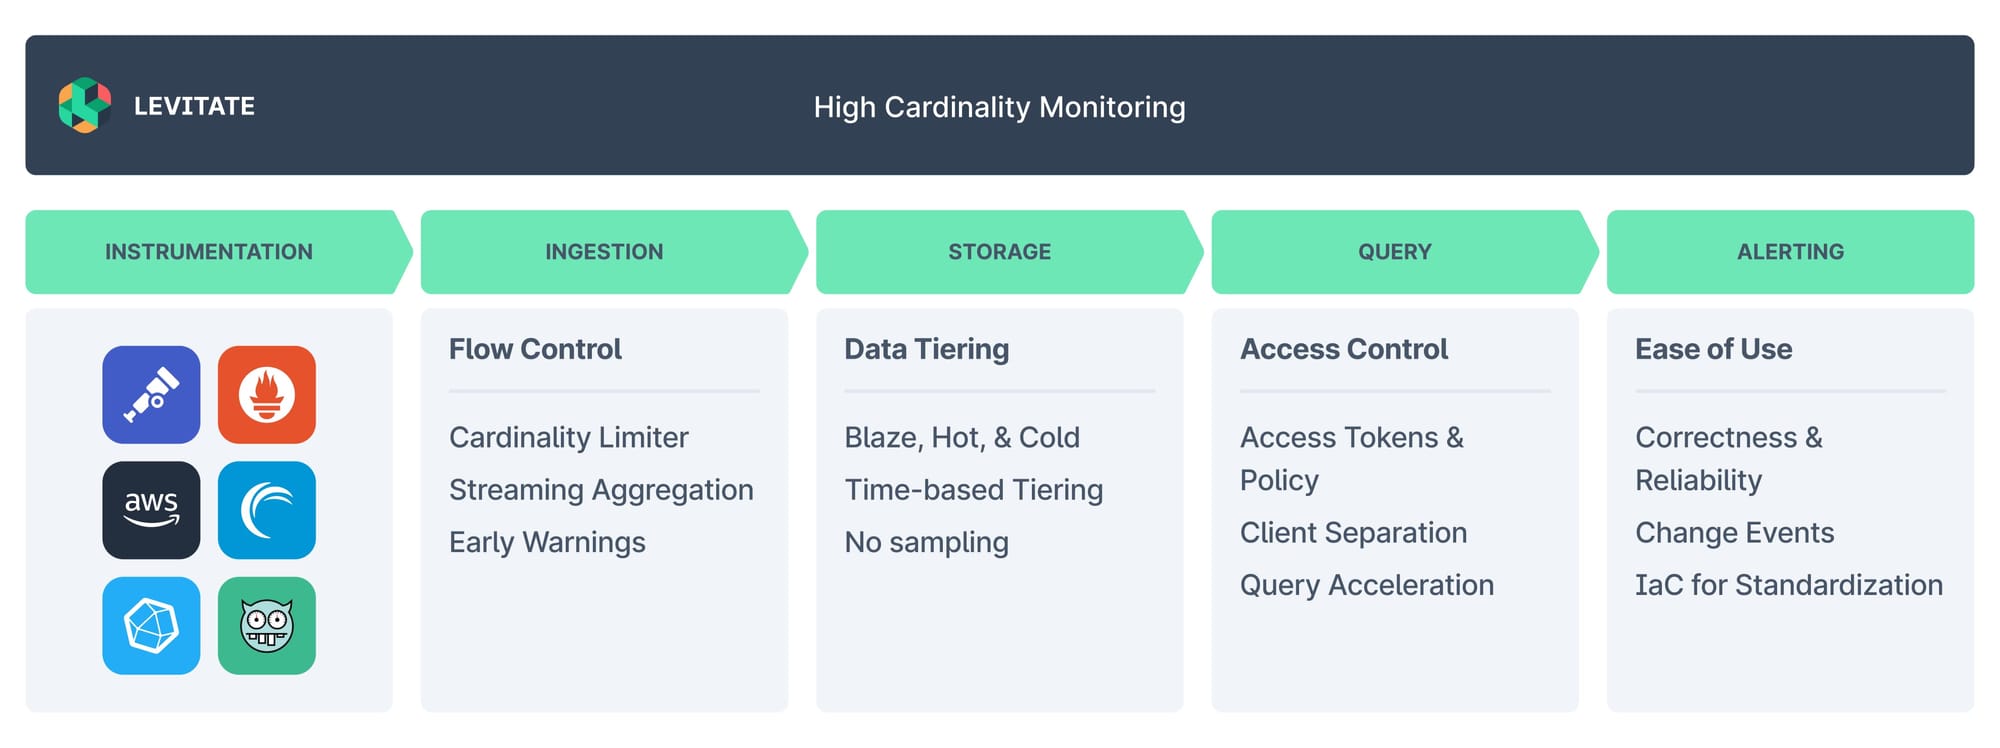
With Levitate, we solve challenges at each step of the monitoring journey. And, we are aiming for the same with Awesome Prometheus Toolkit. We’ll focus on enabling standardization across the instrumentation, query, and alerting pipelines with APT.
In the coming weeks, we’ll add discovery support for more components and their alerting rules.
But we’re toying with the following ideas as well:
- Enable applying rules via the UI, without the need to copy+paste them
- Adding support for Grafana dashboards and their JSON configs
- While the above rules are a great starting point, we see growing companies adapting them to be more dynamic and less noisy — so, rewriting these component rules based on our learnings with our customers
We’d love your thoughts and opinions on the project. And we’d love for you to contribute to APT so we can make the monitoring community’s lives easier quickly. Send us your PRs!
 last9
last9