

A Practical Guide to Python Application Performance Monitoring(APM)
Anjali Udasi

What is Database Monitoring
Anjali Udasi

OpenTelemetry API vs SDK: Understanding the Architecture
Anjali Udasi

APM Logs: How to Get Started for Faster Debugging
Anjali Udasi

From Cloud Native to AI Native: Why Your Observability Stack Needs to Speak Agent
Nishant Modak
Your Apps Are Green. Your Infrastructure Is Dying.
Nishant Modak

A Detailed Guide to Azure Kubernetes Service Monitoring
Faiz Shaikh
Your APIs Are Green. Your Background Jobs Are Dying.
Nishant Modak

What is Real User Monitoring
Anjali Udasi
The Service Discovery Problem Every Developer Knows (But Pretends Doesn't Exist)
Nishant Modak

Top 12 LogicMonitor Alternatives for Developers in 2025
Faiz Shaikh

Top 7 Application Performance Monitoring Tools
Anjali Udasi

Log Format Standards: JSON, XML, and Key-Value Explained
Faiz Shaikh

PostgreSQL Performance: Faster Queries and Better Throughput
Faiz Shaikh

What are Application Metrics?
Anjali Udasi

Jaeger Monitoring: Essential Metrics and Alerting for Production Tracing Systems
Anjali Udasi

Why Your Loki Metrics Are Disappearing (And How to Fix It)
Faiz Shaikh

New in OTel: Auto-Instrument Your Apps with the OTel Injector
Anjali Udasi

New in OTel: Weaver for Consistent Observability with Semantic Conventions
Anjali Udasi

New in OTel: How Prometheus 3.0 Fixes Resource Attributes for OTel Metrics
Anjali Udasi

How sum_over_time Works in Prometheus
Faiz Shaikh

Use Telegraf Without the Prometheus Complexity
Anjali Udasi

Ship Confluent Cloud Observability in Minutes
Anjali Udasi

How to Set Up Real User Monitoring
Anjali Udasi

Monitor Nginx with OpenTelemetry Tracing
Prathamesh Sonpatki

Set Up ClickHouse with Docker Compose
Preeti Dewani

Stream AWS Metrics to Grafana with Last9 in 10 minutes
Faiz Shaikh

Trace Go Apps Using Runtime Tracing and OpenTelemetry
Preeti Dewani

Query and Analyze Logs Visually, Without Writing LogQL
Anjali Udasi

Build Log Automation with Last9's Query API
Prathamesh Sonpatki

Enable Kong Gateway Tracing in 5 Minutes
Anjali Udasi

Kibana Logs: Advanced Query Patterns and Visualization Techniques
Anjali Udasi

Jaeger Metrics: Internal Operations and Service Performance Monitoring
Faiz Shaikh

Optimize LangChain Performance with Trace Analytics
Anjali Udasi

How to Get Grafana Iframe Embedding Right
Anjali Udasi

Elasticsearch with Python: A Detailed Guide to Search and Analytics
Anjali Udasi

What is Log Loss and Cross-Entropy
Faiz Shaikh

Cloud Log Management: A Developer's Guide to Scalable Observability
Anjali Udasi

Troubleshooting LangChain/LangGraph Traces: Common Issues and Fixes
Anjali Udasi

How to Get Logs from Docker Containers
Preeti Dewani

How Replicas Work in Kubernetes
Faiz Shaikh

New in OTel: Improve Consistency Across Signals with OTel Semantic Conventions
Anjali Udasi

Prometheus Group By Label: Advanced Aggregation Techniques for Monitoring
Faiz Shaikh

Instrument LangChain and LangGraph Apps with OpenTelemetry
Anjali Udasi

Docker Status Unhealthy: What It Means and How to Fix It
Faiz Shaikh

LangChain Observability: From Zero to Production in 10 Minutes
Anjali Udasi

How to Run Elasticsearch on Kubernetes
Anjali Udasi

LangChain & LangGraph: The Frameworks Powering Production AI Agents
Anjali Udasi

How to Write Logs to a File in Go
Anjali Udasi

Logging in Docker Swarm: Visibility Across Distributed Services
Faiz Shaikh

Prometheus Gauges vs Counters: What to Use and When
Anjali Udasi

Prometheus and CloudWatch Integration for AWS Metric Collection
Anjali Udasi

How to Configure Docker’s Shared Memory Size (/dev/shm)
Faiz Shaikh

Amazon SQS Metrics: Monitor, Debug, and Optimize Your Message Queues
Anjali Udasi

11 Best Log Monitoring Tools for Developers in 2025
Anjali Udasi

Prometheus Logging Explained for Developers
Prathamesh Sonpatki

Docker Stop vs Kill: When to Use Each Command
Anjali Udasi

Log Management and Query Optimization in Kibana
Faiz Shaikh

Access Logs: Format Specification and Practical Usage
Anjali Udasi

Azure CDN for Static Assets, APIs, and Front Door
Faiz Shaikh

Network Latency: Types, Causes, and Fixes
Anjali Udasi

Everything You Need to Know About Event Logs
Faiz Shaikh

Fluent Bit Helm Chart: Simplify Log Collection in Kubernetes
Anjali Udasi

An Easy Guide to Getting Started with Elastic APM
Faiz Shaikh

How to Monitor Kafka Producer Metrics
Anjali Udasi

A Complete Guide to Linux Log File Locations and Their Usage
Anjali Udasi

How to Integrate OpenTelemetry Collector with Prometheus
Prathamesh Sonpatki

How to Configure and Optimize Prometheus Data Retention
Preeti Dewani

How to Log Into a Docker Container
Anjali Udasi

How to Monitor and Manage Grafana Memory
Anjali Udasi

Graylog vs ELK: Which Log Management Solution Fits Your Stack?
Faiz Shaikh

Jaeger vs Zipkin: Which is Right for Your Distributed Tracing
Anjali Udasi

Prometheus Alerting Examples for Developers
Prathamesh Sonpatki

Traceparent: How OpenTelemetry Connects Your Microservices
Preeti Dewani

How Auditd Logs Help Secure Linux Environments
Anjali Udasi

Windows Error Logs: Your Guide to Simplified Debugging
Faiz Shaikh

Docker Container Lifecycle: Key States and Best Practices
Faiz Shaikh

Kubernetes Logs: How to Collect and Use Them
Anjali Udasi

Server Performance Metrics Explained
Faiz Shaikh

An Easy and Practical Guide to CDN Monitoring
Preeti Dewani
Graylog vs Loki: Key Differences and Use Cases
Anjali Udasi

How to Monitor and Optimize Prometheus CPU Usage
Faiz Shaikh

VPC Log Format: Custom and Advanced Configurations
Anjali Udasi

Common Issues with Grafana Login and How to Fix Them
Anjali Udasi

Track the Right Elasticsearch Metrics Without the Noise
Faiz Shaikh

OpenTelemetry vs Micrometer: Here’s How to Decide
Anjali Udasi

.NET Logging with Serilog and OpenTelemetry
Faiz Shaikh

Getting Started with Loki for Log Management
Anjali Udasi

Grafana Tempo vs Jaeger: Key Features, Differences, and When to Use Each
Anjali Udasi

Top 11 Application Logging Tools for DevOps Engineers in 2025
Faiz Shaikh

Monitoring Node.js: Key Metrics You Should Track
Faiz Shaikh

How to Handle Logging in Microservices Architectures
Anjali Udasi

JVM Metrics: A Complete Guide for Performance Monitoring
Faiz Shaikh

Linux Security Logs: Complete Guide for DevOps and SysAdmins
Anjali Udasi

Ubuntu Cron Logs: A Complete Guide for Engineers
Faiz Shaikh

Angular OpenTelemetry Setup and Troubleshooting
Prathamesh Sonpatki

Solr Key Metrics: The Essential Guide for DevOps & SREs
Faiz Shaikh
CloudWatch vs OpenTelemetry: Choosing What Fits Your Stack
Anjali Udasi

OpenTelemetry PHP: A Detailed Implementation Guide
Preeti Dewani

Track MongoDB Performance Metrics Without the Noise
Anjali Udasi

The Complete Guide to Observing RabbitMQ
Faiz Shaikh

Kubernetes Alerting That Won’t Burn You Out
Anjali Udasi

A Detailed Guide on Docker Container Performance Metrics
Preeti Dewani

Essential Python Monitoring Techniques You Need to Know
Anjali Udasi

The Complete Guide to Node.js Logging Libraries in 2025
Faiz Shaikh

SQL Server Observability: Monitoring, Troubleshooting, and Best Practices
Preeti Dewani

OpenTelemetry Collector vs Exporter: Understanding the Key Differences
Faiz Shaikh

Complete Guide to OTel Exporters: OTLP Endpoint Setup & Best Practices
Anjali Udasi

Getting Started with Jaeger for Distributed Tracing
Preeti Dewani

How Docker Logging Drivers Work
Anjali Udasi

React Logging: How to Implement It Right and Debug Faster
Faiz Shaikh

Easily Query Multiple Metrics in Prometheus
Preeti Dewani

Apache Logs Explained: A Guide for Effective Troubleshooting
Faiz Shaikh

A Practical Guide to Monitoring Ubuntu Servers
Anjali Udasi

AWS Centralized Logging: A Complete Implementation Guide
Anjali Udasi

The Ultimate Guide to GCP Logs for DevOps Engineers
Preeti Dewani

What Is a Logging Formatter and Why Use One?
Faiz Shaikh

Simplifying Container Observability for DevOps Teams
Anjali Udasi

Apache Tomcat Performance Monitoring: Basics and Troubleshooting Tips
Faiz Shaikh

A Guide to OpenTelemetry Tracing in Distributed Systems
Prathamesh Sonpatki

RUM vs Synthetic Monitoring: Understanding the Core Differences
Anjali Udasi

Prometheus Distributed Tracing: An Easy-to-Follow Guide for Engineers
Preeti Dewani

Adding OpenTelemetry to Your React Apps: A Practical Guide
Prathamesh Sonpatki

What is API Monitoring and How to Build API Metrics Dashboards
Anjali Udasi

The Ultimate HBase Monitoring Guide for Engineers
Faiz Shaikh

Correlation ID vs Trace ID: Understanding the Key Differences
Faiz Shaikh

Everything You Need to Know About OpenTelemetry Histograms
Prathamesh Sonpatki

How Does OpenTelemetry Logging Work?
Anjali Udasi

Why Should You Care About Endpoint Monitoring?
Anjali Udasi
Why Grafana's Rate Function Is Your Dashboard's Best Kept Secret
Anjali Udasi

How to Use OpenTelemetry with Your GraphQL Stack
Anjali Udasi

Metrics Monitoring: The Only Guide You'll Need
Faiz Shaikh

Getting Started with OpenTelemetry Custom Metrics
Prathamesh Sonpatki

Traces & Spans: Observability Basics You Should Know
Anjali Udasi
Zabbix vs Grafana: Which Monitoring Tool Fits You Best?
Faiz Shaikh

Loki vs Prometheus: Side-by-Side Comparison for Logs and Metrics
Anjali Udasi

Distributed Network Monitoring: Guide to Getting Started & Troubleshooting
Anjali Udasi

7 Top ELK Alternatives: Finding the Right Observability Stack
Anjali Udasi

How to Use MySQL Performance Analyzer
Anjali Udasi

A Comprehensive Guide to Monitoring Disk I/O on Linux
Anjali Udasi

Apache Cassandra Monitoring: Tools, Challenges & Best Practices
Anjali Udasi

GDPR Log Management: A Practical Guide for Engineers
Prathamesh Sonpatki

Ubuntu var log messages: A Complete Guide for System Admins
Preeti Dewani

Getting Started with Elastic Load Balancer (ELB) Metrics
Anjali Udasi

A Closer Look at Docker Build Logs for Troubleshooting
Faiz Shaikh

How to Connect ELK Stack with Grafana
Anjali Udasi

Everything You Need to Know to Start Monitoring Postgres
Faiz Shaikh

What is /var/log: Understanding Linux System Logs
Anjali Udasi

Log Consolidation Made Easy for DevOps Teams
Faiz Shaikh

APM Observability: A Practical Guide for DevOps and SREs
Anjali Udasi

Getting Started with Prometheus Metrics Endpoints
Anjali Udasi

Troubleshooting LoggerFactory Logging Issues
Preeti Dewani

Database Monitoring Metrics: Each Stage Guide (2025)
Faiz Shaikh

Histogram Buckets in Prometheus Made Simple
Prathamesh Sonpatki

How to Use OpenTelemetry with Postgres
Prathamesh Sonpatki

Logging vs Monitoring: What’s the Real Difference?
Anjali Udasi

Debug Logging: A Comprehensive Guide for Developers
Anjali Udasi
Observability vs APM: What’s the Real Difference?
Anjali Udasi

How to Use Prometheus for APM
Prathamesh Sonpatki

Regex Optimization Techniques: 14 Methods for DevOps Performance
Anjali Udasi

HAProxy vs NGINX Performance: A Comprehensive Analysis
Faiz Shaikh

Logstash Grok Examples: A Detailed Guide to Pattern Matching
Anjali Udasi

FastAPI Python for Infra and Ops, Made Simple
Anjali Udasi

Comparing ELK, Grafana, and Prometheus for Observability
Anjali Udasi

Envoy vs HAProxy: Which Proxy Server Is Right for Your Infrastructure?
Faiz Shaikh

How to View and Understand VPC Flow Logs
Anjali Udasi

OpenTelemetry for Spring: Full Implementation Guide
Prathamesh Sonpatki

Java Util Logging Configuration: A Practical Guide for DevOps & SREs
Anjali Udasi

An Easy Guide to Pausing Docker Containers
Anjali Udasi

Essential Unix Commands Cheat Sheet for DevOps Engineers
Faiz Shaikh

Java GC Logs: How to Read and Debug Fast
Anjali Udasi

Pod Memory Usage: Tracking, Commands & Troubleshooting
Anjali Udasi

API Latency: Definition, Measurement, and Optimization Techniques
Anjali Udasi

The Ultimate Guide to Ubuntu Performance Monitoring
Faiz Shaikh

The Role of Log Shippers in Your Stack
Anjali Udasi

Best 6 AWS EC2 Alternatives for DevOps Teams in 2025
Anjali Udasi

How to Master Log Management with Logrotate in Docker Containers
Anjali Udasi

How to Configure ContainerPort in Kubernetes (The Easy Way)
Anjali Udasi

Log4j vs Log4j2: Which Logging Framework Should You Choose
Faiz Shaikh

Why Do You Need a Redis Monitor in Place?
Prathamesh Sonpatki

How Sumo Logic Pricing Works
Faiz Shaikh

When Should You Enable Trace-Level Logging?
Anjali Udasi

9 Best Container Monitoring Tools You Should Know in 2025
Anjali Udasi

Breaking Down Splunk Costs for SREs and DevOps Teams
Anjali Udasi

Reliability vs Availability: A Simple Breakdown
Anjali Udasi

Java Logging: Troubleshooting Tips and Best Practices
Faiz Shaikh

Python Loguru: The Logging Cheat Code You Need in Your Life
Preeti Dewani
New Relic vs Datadog: The Complete Comparison
Anjali Udasi

MySQL Logs: Your Guide for Database Performance
Faiz Shaikh
Last9 MCP Server: Fix Production Issues in Your Local Environment
Nishant Modak

SRECon Americas 2025 Recap Day 3
Prathamesh Sonpatki

SRECon Americas 2025 Recap Day 2
Prathamesh Sonpatki

Getting Started with E-commerce Audit Logs: A Simple Guide
Anjali Udasi

21 PromQL Tricks Every Developer Should Know
Preeti Dewani

Docker Compose Health Checks: An Easy-to-follow Guide
Anjali Udasi

An Easy and Comprehensive Guide to Prometheus API
Faiz Shaikh

SRECon Americas 2025 Recap Day 1
Prathamesh Sonpatki

Linux Event Logs: Your Troubleshooting Guide
Anjali Udasi

Ubuntu Crash Logs: Find, Fix, and Prevent System Failures
Preeti Dewani

RabbitMQ Logs: Monitoring, Troubleshooting & Configuration
Prathamesh Sonpatki

Top 7 Microservices Monitoring Tools to Consider in 2025
Anjali Udasi

End-to-End Monitoring: Your Guide to System Visibility
Faiz Shaikh

Zero Code Instrumentation: The Missing Link in Observability
Anjali Udasi

Observability Pipeline: An Easy-to-Follow Guide for Engineers
Anjali Udasi

An In-Depth Metricbeat Guide for DevOps Teams
Preeti Dewani

No-Jargon Guide to Application Dependency Mapping
Faiz Shaikh

What Is CDN? The Complete Guide for DevOps Engineers
Anjali Udasi

Your Observability Questions, Answered
Anjali Udasi

Website Logging: Everything You Need to Get Started
Anjali Udasi

OpenTelemetry Backends: A Practical Implementation Guide
Prathamesh Sonpatki

Log File Analysis: A Guide for DevOps Engineers
Faiz Shaikh

Syslog Servers Explained: How They Help with Logging
Preeti Dewani

systemctl: The Complete Guide to Managing Linux Services
Prathamesh Sonpatki

Distributed Tracing: An Advanced Guide for DevOps & SREs
Anjali Udasi
![Full-Stack Observability: What It Is [Minus the Fluff]](https://last9.ghost.io/content/images/2025/03/observability.webp)
Full-Stack Observability: What It Is [Minus the Fluff]
Anjali Udasi
Less War, More Room: Breaking Down Operational Silos
Prathamesh Sonpatki, Sahil Khan

Essential Prometheus Queries: Simple to Advanced
Anjali Udasi

How to Set Up Logging in Node.js (Without Overthinking It)
Preeti Dewani

The Complete Guide to Monitoring Container CPU Usage
Anjali Udasi

A Practical Guide to the OpenTelemetry Java Agent
Prathamesh Sonpatki

How Do Dropwizard Metrics Help Monitor Application Performance?
Anjali Udasi

What is Log Data? The SRE's Essential Guide
Anjali Udasi

Performance Impact of High Cardinality in Time-Series DBs
Anjali Udasi

Syslog Monitoring: A Guide to Log Management and Analysis
Anjali Udasi

Prometheus Port Configuration: A Detailed Guide
Prathamesh Sonpatki

How to Configure SAML SSO with Keycloak
Anjali Udasi

PHP Error Logs: The Complete Troubleshooting Guide You Need
Preeti Dewani

Getting Started with OpenTelemetry JavaScript
Prathamesh Sonpatki

Auto Instrumentation: An In-Depth Guide
Anjali Udasi

High Cardinality Is Eating Your Storage Budget—Here’s Why
Anjali Udasi
![A Guide to Fixing Kafka Consumer Lag [Without Jargon]](https://last9.ghost.io/content/images/2025/03/kafka.webp)
A Guide to Fixing Kafka Consumer Lag [Without Jargon]
Prathamesh Sonpatki

Retrieving All Keys in Redis: Commands & Best Practices
Anjali Udasi

Logging Best Practices to Reduce Noise and Improve Insights
Prathamesh Sonpatki

High vs Low Cardinality: Is Your Observability Stack Failing?
Anjali Udasi

Elasticsearch vs. Solr: What Developers Need to Know in 2025
Anjali Udasi

How to Make the Most of Redis Pipeline
Anjali Udasi

Last9 Feb ‘25 Recap: What’s New
Sahil Khan

Dynatrace vs. AppDynamics: 2025 Performance Monitoring Guide
Anjali Udasi

Nginx Logging: A Complete Guide for Beginners
Aditya Godbole

OpenSearch Operator: Deployment, Scaling, and Optimization
Preeti Dewani

Prometheus API: From Basics to Advanced Usage
Prathamesh Sonpatki

journalctl Commands Cheatsheet for Troubleshooting
Anjali Udasi

An In-depth Guide on Ubuntu ZFS Guide
Anjali Udasi

Advanced Container Resource Monitoring with docker stats
Preeti Dewani

Why Server Health Monitoring Matters (And How to Do It Right)
Anjali Udasi

The Ultimate Guide to Docker Clear Logs
Anjali Udasi

How to Read System Logs Without the Headache
Anjali Udasi

Windows Event Logs: Monitoring, Alerts, and Compliance
Anjali Udasi

Everything You Need to Know About SIEM Logs
Anjali Udasi

Getting Started with the Grafana API: Practical Use Cases
Prathamesh Sonpatki

Python Logging Exceptions: The Setup Guide You Actually Need
Preeti Dewani

Getting Started with Golang ORMs: A Beginner's Guide
Prathamesh Sonpatki

The Complete Guide to OpenTelemetry and APM
Anjali Udasi

Nginx Error Logs: Troubleshooting and Security Guide
Preeti Dewani

EC2 Monitoring: A Practical Guide for AWS Engineers
Anjali Udasi

How to Use journalctl --last to Check Recent System Logs
Prathamesh Sonpatki

What is OOM? A Guide to Out of Memory Issues
Anjali Udasi

Fixing the "java.lang.OutOfMemoryError: Java heap space" Error
Prathamesh Sonpatki

CloudFront on AWS: Basics & Setup Guide
Preeti Dewani

OpenTelemetry vs. Datadog: Key Differences Explained
Anjali Udasi

Prometheus Functions: How to Make the Most of Your Metrics
Preeti Dewani

9 Powerful Zabbix Alternatives You Shouldn’t Ignore
Anjali Udasi

Your Go-To Linux Commands Cheat Sheet
Anjali Udasi

How to Effectively Monitor Nginx and Prevent Downtime
Anjali Udasi

Everything You Need to Know About OpenTelemetry Agents
Prathamesh Sonpatki

A Guide to Configuring Logback for Java Applications
Anjali Udasi

Getting Started with OpenTelemetry for Browser Monitoring
Preeti Dewani

How to Implement OpenTelemetry in NestJS
Aditya Godbole

Elasticsearch Reindex API: A Guide to Data Management
Prathamesh Sonpatki

Pino Logger: The Fastest and Efficient Node.js Logging Library
Prathamesh Sonpatki

8 Best Grafana Alternatives: Open-Source & Commercial
Anjali Udasi

OpenTelemetry Metrics Aggregation: A Detailed Guide
Anjali Udasi

The 9 Best Sentry Alternatives for Error Monitoring in 2025
Anjali Udasi

How to Build Observability into Chaos Engineering
Anjali Udasi

How to Implement OpenTelemetry in Next.js
Preeti Dewani

Prometheus with Docker Compose: The Complete Setup Guide
Prathamesh Sonpatki

Apache Monitoring: Setup Guide, Tools, and Best Practices
Anjali Udasi

OpenTelemetry Visualization Setup: A Developer's Guide
Prathamesh Sonpatki

How to Use OpenSearch with Python for Search and Analytics
Preeti Dewani

MongoDB Monitoring: Everything You Need to Know
Anjali Udasi

An In-Depth Guide to Java Performance Monitoring for SREs
Preeti Dewani

Integrating OpenTelemetry with Grafana for Better Observability
Aditya Godbole

OpenTelemetry UI: The Ultimate Guide for Developers
Prathamesh Sonpatki

Your 2025 Guide to the 11 Best Infrastructure Monitoring Tools
Anjali Udasi

OpenTelemetry Java: A Detailed Guide with Examples and Troubleshooting
Anjali Udasi

Top 13 Kafka Monitoring Tools You Should Know
Anjali Udasi

Redis Metrics: Monitoring, Performance, and Best Practices
Anjali Udasi
How to Use OpenTelemetry for Kubernetes Autoscaling Metrics
Prathamesh Sonpatki

OpenTelemetry vs. ELK: Key Differences and When to Use Each
Anjali Udasi

How to Overcome Challenges and Scale the OpenTelemetry Collector
Aditya Godbole

A Quick Guide for OpenTelemetry Python Instrumentation
Prathamesh Sonpatki

Linux OOM Killer: A Detailed Guide to Memory Management
Anjali Udasi

Helm vs Terraform: A Detailed Comparison for Developers
Anjali Udasi

Tomcat Logs: Locations, Types, Configuration, and Best Practices
Anjali Udasi

Kubernetes QoS Explained: Classes & Resource Management
Anjali Udasi

The Ultimate Guide to HAProxy Log Format
Preeti Dewani

An Easy Guide to OpenFeature Flagging
Anjali Udasi

What is DynamoDB Throttling and How to Fix It
Anjali Udasi

Understanding Syslog Formats: A Quick and Easy Guide
Anjali Udasi
Elastic vs. Splunk: Which One Is Right for You?
Anjali Udasi

Log Retention: Policies, Best Practices & Tools (With Examples)
Anjali Udasi

Telemetry Data Platform: Everything You Need to Know
Anjali Udasi

Types of Pods in Kubernetes: An In-depth Guide
Anjali Udasi

Ubuntu System Logs: How to Find and Use Them
Anjali Udasi

How to Filter Docker Logs with Grep
Anjali Udasi
Monitoring Kubernetes Resource Usage with kubectl top
Faiz Shaikh

AWS CSPM Explained: How to Secure Your Cloud the Right Way
Anjali Udasi
Distributed Tracing 101: Definition, Working and Implementation
Anjali Udasi

The Ultimate Guide to OpenTelemetry Visualization
Prathamesh Sonpatki

Log Levels: Answers to the Most Common Questions
Anjali Udasi

How Azure Observability Optimizes Performance and Monitoring
Anjali Udasi

Everything You Need to Know About Microsoft Sentinel Pricing
Anjali Udasi

A Comprehensive Guide to Heaps in Java
Preeti Dewani

Apache Solr: Features, Architecture, and Use Cases
Anjali Udasi

Postgres Logs 101: Types, Configuration, and Troubleshooting
Anjali Udasi

NGINX Log Monitoring: What It Is, How to Get Started, and Fix Issues
Anjali Udasi

How to Monitor Error Logs in Real-Time: An In-Depth Guide
Anjali Udasi
Sentry vs Datadog: Which is the Right Tool for Your DevOps Needs
Anjali Udasi

AWS CloudWatch Custom Metrics: Types & Setup Guide [With Examples]
Anjali Udasi

Getting Started with OpenTelemetry Java SDK
Prathamesh Sonpatki

10 Kubernetes Monitoring Tools You Can't-Miss in 2025
Anjali Udasi

Top 11 API Monitoring Tools You Need to Know
Anjali Udasi
![Website Performance Benchmarks: What You Should Aim For [with Examples]](https://last9.ghost.io/content/images/2025/02/monitoring-927906281a0979ff.webp)
Website Performance Benchmarks: What You Should Aim For [with Examples]
Anjali Udasi

SSHD Logs 101: Configuration, Security, and Troubleshooting Scenarios
Anjali Udasi

How to Master Zap Logger for Clean, Fast Logs
Prathamesh Sonpatki

OpenTelemetry Processors: Workflows, Configuration Tips, and Best Practices
Prathamesh Sonpatki

Logging in Go with Slog: A Detailed Guide
Preeti Dewani

Logfiles: What They Reveal and How to Use Them
Anjali Udasi

How to Spot and Fix Memory Leaks in Java?
Anjali Udasi

The Basics of Log Parsing (Without the Jargon)
Anjali Udasi

JMX Metrics: Types, What to Monitor, and When to Check
Anjali Udasi

JMX Monitoring: Your Go-To Guide for Java Application Management
Anjali Udasi
Last9 Jan ‘25 Recap: What’s New
Sahil Khan

Rails Logger: How to Customize, Configure, and Optimize Your Logs
Prathamesh Sonpatki

MySQL Monitoring: Key Metrics, Built-in Tools, and Open-Source Solutions
Anjali Udasi

Pingdom Alternatives: The Best 7 Options for Website Monitoring
Anjali Udasi

Pod Exec in K8s: Advanced Exec Scenarios and Best Practices
Prathamesh Sonpatki
Kubernetes Pods vs Nodes: What Sets Them Apart
Anjali Udasi

OpenMetrics vs OpenTelemetry: A Detailed Comparison
Anjali Udasi

Top 5 Dynatrace Alternatives: Compare Features, Pricing & More
Anjali Udasi

RUM Metrics Explained: What to Track for Better User Experience
Anjali Udasi

5 Common Incident Severity Levels You Should Know
Anjali Udasi

Syslog Levels Made Simple: Why They Matter for Your Logs
Anjali Udasi

7 Best and Scalable SolarWinds Alternatives to Consider in 2025
Anjali Udasi

TCP Monitoring Made Simple: Keep Your Network in Check
Anjali Udasi

IoT Monitoring: Why It Matters and How to Do It Right?
Anjali Udasi

Error Logs: What They Are, Why They Matter, and How to Use Them
Anjali Udasi

Datadog Pricing: All your Questions Answered
Anjali Udasi

git fetch vs pull: Key Differences Explained
Anjali Udasi

Your Go-To Git Commands CheatSheet
Prathamesh Sonpatki

An Easy Guide to OpenTelemetry Environment Variables
Anjali Udasi

OpenTelemetry vs Jaeger: Which Should You Pick?
Anjali Udasi

OpenTelemetry Collector with Docker: A Detailed Guide
Faiz Shaikh

7 Leading Network Monitoring Tools for Enterprises
Anjali Udasi
OpenTelemetry vs. Prometheus: An Easy to Follow Comparison
Anjali Udasi

AWS OpenSearch: Setup, Performance Tips, and Practical Examples
Anjali Udasi

SIEM Architecture: Key Components, Integrations, and More
Anjali Udasi

OpenTelemetry Profiling: A Look into Performance Insights
Prathamesh Sonpatki

Apdex Score 101: Definition, Calculation, and Limitations
Anjali Udasi

Everything You Should Know About OpenTelemetry Collector Contrib
Anjali Udasi

Getting Started with the OpenTelemetry Helm Chart in K8s
Anjali Udasi

A Complete Guide to Threat Hunting: Tools and Techniques
Anjali Udasi

How to Use the Laravel Scheduler for Task Management
Anjali Udasi

Getting Started with Bun.js: A Quick Guide
Prathamesh Sonpatki

Serilog: Configuration, Error Handling & Best Practices
Anjali Udasi

How to Build a Cloud Strategy That Works for Your Business
Anjali Udasi

SLF4J vs Log4j: Key Differences and Choosing the Right One
Preeti Dewani

Total Blocking Time (TBT): What It Is, Why It Matters, and How to Fix It
Anjali Udasi

Log Levels: Different Types and How to Use Them
Anjali Udasi

What is Single Pane of Glass Monitoring and How It Works
Anjali Udasi

Node.js Worker Threads Explained (Without the Headache)
Prathamesh Sonpatki

Loki S3 Storage: A Guide for Efficient Log Management
Anjali Udasi

Java Application Monitoring: How It Works, Tools, and Best Practices
Faiz Shaikh

Windows Server Monitoring: Tools, Best Practices & Strategies
Anjali Udasi

pino-pretty: A Guide to Pretty-Printing Your Logs
Preeti Dewani

CloudWatch Metrics: Key Features, Working & Cost Management
Anjali Udasi

Cloudcraft: A Simple Tool for Cloud Architecture Design
Anjali Udasi

7 Best DigitalOcean Alternatives for Developers in 2025
Anjali Udasi

gRPC vs HTTP vs REST: Which is Right for Your Application?
Anjali Udasi

How to Set Up and Manage Cron Jobs in Node.js: Step-by-Step Guide
Faiz Shaikh

10 Steps to Fix Upstream Connect Errors
Prathamesh Sonpatki

Heroku Logs: Everything You Need to Know
Anjali Udasi

Docker vs Docker Swarm: Key Differences Explained
Anjali Udasi

Why Data Observability is Important for Your Business
Anjali Udasi

Top 7 Cloud Providers: The Best AWS Alternatives
Anjali Udasi

Splunk vs. Datadog: A Side-by-Side Comparison
Anjali Udasi

npm Packages: Cheatsheet, Troubleshooting & More
Preeti Dewani

What Unified Observability Means for Your System
Anjali Udasi

Getting the Most Out of Windows Event Logs
Anjali Udasi

Observability Platform Migration: What You Need to Know
Anjali Udasi

Container Security: What It Is, Architecture, and Best Practices
Anjali Udasi

OpenSearch Serverless: How It Works & Key Comparisons
Anjali Udasi

Log Tracing vs Logging: Understanding the Difference
Anjali Udasi

Essential Guide to Log Rotation in Linux
Preeti Dewani
The Power of Sidecar Containers in Kubernetes Explained
Anjali Udasi

A Guide to Spring Boot Logging: Best Practices & Techniques
Prathamesh Sonpatki

What Makes Azure WAF Essential for Web Apps?
Anjali Udasi

A Simple Guide to Understanding MongoDB Logs
Prathamesh Sonpatki

How to Set Up and Manage Cron Jobs in Windows
Anjali Udasi

Application Logs: Key Components, Types, & Best Practices
Anjali Udasi

Parquet vs CSV: Which Format Should You Choose?
Anjali Udasi

Monolithic vs. Microservices: The Great Architecture Debate
Anjali Udasi

Podman vs Docker: Key Differences and Which is Better
Anjali Udasi

Types of Errors in Python and How to Fix Them
Preeti Dewani

Understanding Logrus: The Ultimate Go Logger for Efficient Logging
Anjali Udasi

Cloud Tracing in Distributed Systems: Gaining Visibility
Anjali Udasi

AWS WAF: What It Is and Why It Matters
Anjali Udasi

Production Winston Logging: From Basic Setup to Enterprise Scale
Anjali Udasi

Kafka Observability: Key to Managing Distributed Systems
Preeti Dewani

eBPF for Enhanced Observability in Modern Systems
Anjali Udasi

Optimizing Systems with the Observability Maturity Model
Anjali Udasi

How to Set Up OpenTelemetry in Django
Prathamesh Sonpatki

Application Monitoring Best Practices: A Comprehensive Guide
Anjali Udasi

Implementing OpenTelemetry in Ruby: A Guide for Developers
Aditya Godbole

Implementing Distributed Tracing with OpenTelemetry
Prathamesh Sonpatki

The Essentials of SNMP Monitoring in Networks
Anjali Udasi

Integrating OpenTelemetry with Elixir: A Step-by-Step Guide
Aditya Godbole

The Basics of Network Device Monitoring Explained
Anjali Udasi

The Role of OpenTelemetry Events in Improving Observability
Preeti Dewani

OpenTelemetry Context Propagation for Better Tracing
Preeti Dewani

gRPC with OpenTelemetry: Observability Guide for Microservices
Prathamesh Sonpatki

Why You Need Server Monitoring Tools and How to Choose
Anjali Udasi

OpenTelemetry with Flask: A Comprehensive Guide for Web Apps
Sahil Khan

Top 5 Firebase Alternatives for 2024: Best Picks
Anjali Udasi

Kafka with OpenTelemetry: Distributed Tracing Guide
Prathamesh Sonpatki

Why Cloud Security Monitoring is Crucial for Your Business
Anjali Udasi

Linux Syslog Explained: Configuration and Tips
Faiz Shaikh

A Complete Guide to Integrating OpenTelemetry with FastAPI
Preeti Dewani

The Best Heroku Alternatives for Developers in 2024
Anjali Udasi

The Best Linux Monitoring Tools for 2024
Anjali Udasi

Instrumenting AWS Lambda Functions with OpenTelemetry
Aditya Godbole

DNS Monitoring: Everything You Need to Know
Anjali Udasi

Introduction to OpenTelemetry Express for Node.js Applications
Prathamesh Sonpatki

Getting Started with OpenTelemetry Logging: A Practical Guide
Prathamesh Sonpatki

Kubernetes vs Docker Swarm: Which to Choose for Containers?
Anjali Udasi

Grafana Variables: Dynamic Dashboards Done Right
Anjali Udasi

Docker Compose Logs: An In-Depth Guide for Developers
Anjali Udasi

Python Logging with Structlog: A Comprehensive Guide
Preeti Dewani

systemctl logs: A Guide to Managing Logs in Linux
Faiz Shaikh

Kubernetes Alternatives: Top Options to Explore in 2024
Anjali Udasi

A Guide to Database Optimization for High Traffic
Prathamesh Sonpatki
AWS re:Invent 2024 Day 4 Recap
Prathamesh Sonpatki

Datadog vs Dynatrace: A Comprehensive Comparison
Anjali Udasi

Grafana and Docker: A Simple Way to Monitor Everything
Anjali Udasi

AWS re:Invent 2024 Day 3 Recap
Prathamesh Sonpatki

Top 10 Docker Alternatives: Cost, Performance & Use Cases
Anjali Udasi

LLM Observability: Architecture, Key Components, and Common Challenges
Anjali Udasi
AWS re:Invent 2024 Day 2 Recap
Prathamesh Sonpatki
MongoDB vs Elasticsearch: Key Differences Explained
Anjali Udasi

API Monitoring: A Comprehensive Guide for Developers
Anjali Udasi

AWS re:Invent 2024 Day 1 Recap
Prathamesh Sonpatki

A Beginner's Guide to GCP Monitoring
Prathamesh Sonpatki, Anjali Udasi

How AWS Step Functions Work for Serverless Apps
Anjali Udasi

Fluentd vs Fluent Bit – A Comprehensive Overview
Prathamesh Sonpatki, Anjali Udasi

The Complete Guide to docker compose restart
Preeti Dewani

Top 5 Open Source SIEM Tools for Security Monitoring
Anjali Udasi

Enhancing Observability with Fluent Bit and OpenTelemetry
Prathamesh Sonpatki

Kubernetes CPU Throttling: What It Is and How to Avoid It
Anjali Udasi

Full-Stack Observability for Better Application Performance
Anjali Udasi

A Complete Guide to Using the Grok Debugger
Preeti Dewani

Filebeat vs Logstash: Key Differences for Your Logging Needs
Anjali Udasi

A Complete Guide to Kubernetes Observability
Prathamesh Sonpatki
Kibana vs Grafana: Key Differences and Use Cases
Anjali Udasi

Debug Failed Cron Jobs: Complete Guide to Crontab Logs
Anjali Udasi

The Parquet Files: Why This File Format Is Your Data's Best Friend
Preeti Dewani

Django Logging: Everything You Need to Know
Preeti Dewani

Morgan npm and Its Role in Node.js
Gabriel Diaz

Extracting Account-Level CDN Metrics from Akamai Logs with Last9
Prathamesh Sonpatki, Aditya Godbole
AWS re: Invent 2024: Must-Know Tips & What to Expect
Prathamesh Sonpatki, Anjali Udasi

Logging Errors in Go with ZeroLog: A Simple Guide
Prathamesh Sonpatki

Your Guide to the 7 Best Tracing Tools in Observability
Anjali Udasi

Proactive Monitoring: What It Is, Why It Matters, & Use Cases
Anjali Udasi

Docker Logs Tail: A Developer's Guide
Anjali Udasi

Prometheus Metrics Types - A Deep Dive
Tripad Mishra

AWS Monitoring Tools to Optimize Cloud Performance
Anjali Udasi
OpenSearch vs. Elasticsearch: What’s the Real Difference?
Anjali Udasi

Kubernetes Observability with OpenTelemetry Operator
Prathamesh Sonpatki

Why Golden Signals Matter for Monitoring
Anjali Udasi

KubeCon NA 2024 Day 4 Recap
Prathamesh Sonpatki

KubeCon NA 2024 Day 3 Recap
Prathamesh Sonpatki

The Practical Guide to Alert Sanity: From Chaos to Calm
Aditya Godbole

Getting Started with OpenTelemetry in Rust
Prathamesh Sonpatki

KubeCon NA 2024 Day 2 Recap
Prathamesh Sonpatki
KubeCon NA 2024 Day 1 Recap: Observability Day & More
Prathamesh Sonpatki
AWS CloudTrail Guide: Uses, Events, and Setup Explained
Anjali Udasi

What is ELK: Core Components, Ecosystem & Setup Guide
Anjali Udasi

Last9’s Single Pane for High Cardinality Observability
Sahil Khan

How Structured Logging Makes Troubleshooting Easier
Anjali Udasi

Flask Logging Made Simple for Developers
Prathamesh Sonpatki

Understanding Docker Logs: A Quick Guide for Developers
Gabriel Diaz
Must-Attend Talks and Activities at KubeCon 2024
Anjali Udasi

Prometheus Pushgateway: How to Track Short-Lived Jobs
Anjali Udasi

Kubernetes Microservices: Key Concepts Explained
Anjali Udasi

SRECon EMEA 2024 - Day 3
Prathamesh Sonpatki

SRECon EMEA 2024 - Day 2
Prathamesh Sonpatki

The Only Kubectl Commands Cheat Sheet You’ll Ever Need
Anjali Udasi

SRECon EMEA 2024 - Day 1
Prathamesh Sonpatki

Scaling Prometheus: Tips, Tricks, and Proven Strategies
Prathamesh Sonpatki
Datadog vs. Grafana: Finding Your Ideal Monitoring Tool
Anjali Udasi

Getting Started with Host Metrics Using OpenTelemetry
Prathamesh Sonpatki

Prometheus Alertmanager: What You Need to Know
Anjali Udasi

Understanding Kubernetes Metrics Server: Your Go-to Guide
Anjali Udasi

How to Cut Down Amazon CloudWatch Costs
Anjali Udasi

Prometheus RemoteWrite Exporter: A Comprehensive Guide
Prathamesh Sonpatki

Log Analytics 101: Everything You Need to Know
Prathamesh Sonpatki, Anjali Udasi

The Developer’s Handbook to Centralized Logging
Prathamesh Sonpatki, Anjali Udasi

kubectl exec: Commands, Examples, and Best Practices
Anjali Udasi

Log Anything vs Log Everything
Prathamesh Sonpatki

OTEL Collector Monitoring: Best Practices & Guide
Anjali Udasi

The Ultimate Guide to Application Performance Monitoring (APM)
Anjali Udasi

Docker Monitoring with Prometheus: A Step-by-Step Guide
Prathamesh Sonpatki, Anjali Udasi

9 Datadog Alternatives Worth Considering in 2025
Anjali Udasi

High Availability in Prometheus: Best Practices and Tips
Anjali Udasi

Synthetic Monitoring Explained: A Developer's Guide
Anjali Udasi

What are OpenTelemetry Metrics? A Comprehensive Guide
Anjali Udasi

How to Monitor Ephemeral Storage Metrics in Kubernetes
Anjali Udasi

Prometheus Recording Rules: Developer Guide to Optimization
Prathamesh Sonpatki

Tail Latency: Key in Large-Scale Distributed Systems
Anjali Udasi

Prometheus Rate Function: A Practical Guide to Using It
Anjali Udasi

Adding Cluster Labels to Kubernetes Metrics
Prathamesh Sonpatki

How to Use Jaeger with OpenTelemetry
Anjali Udasi
Prometheus Alternatives: Monitoring Tools You Should Know
Gabriel Diaz

Optimizing Prometheus Remote Write Performance: Guide
Gabriel Diaz

Identify Root Spans in Otel Collector
Prathamesh Sonpatki

What is Prometheus Remote Write
Prathamesh Sonpatki

Golang Logging: A Comprehensive Guide for Developers
Prathamesh Sonpatki, Preeti Dewani

Developer's Guide to Installing OpenTelemetry Collector
Prathamesh Sonpatki

Top 10 Platform Engineering Tools in 2024
Prathamesh Sonpatki

PromCon 2024 — Day 2
Prathamesh Sonpatki
Prometheus Operator Guide
Anjali Udasi
PromCon 2024 — Day 1
Prathamesh Sonpatki

PromQL Cheat Sheet: Must-Know PromQL Queries
Prathamesh Sonpatki, Anjali Udasi

Streaming Aggregation: Real-Time Data Processing in 2024
Anjali Udasi
OpenTelemetry Protocol (OTLP): A Deep Dive into Observability
Gabriel Diaz
Microservices Monitoring with the RED Method
Prathamesh Sonpatki

kube-state-metrics: Your Guide to Kubernetes Observability
Prathamesh Sonpatki, Anjali Udasi
Instrumenting fasthttp with OpenTelemetry: A Complete Guide
Tushar Choudhari

PromQL: A Developer's Guide to Prometheus Query Language
Gabriel Diaz

PromQL for Beginners: Getting Started with Prometheus
Gabriel Diaz

Hot Reload for OpenTelemetry Collector: Step-by-Step Guide
Prathamesh Sonpatki

OpenTelemetry Filelog Receiver: Collecting Kubernetes Logs
Prathamesh Sonpatki

What is Prometheus
Gabriel Diaz

Python Logging Best Practices: The Ultimate Guide
Anjali Udasi

2024's Best Cloud Monitoring Tools: Updated Insights
Anjali Udasi

Top Observability Best Practices for Microservices in 2024
Anjali Udasi

7 Splunk Alternatives Worth Checking Out in 2025
Prathamesh Sonpatki

A Deep Dive into Log Aggregation Tools
Anjali Udasi

Using Kubectl Logs: Guide to Viewing Kubernetes Pod Logs
Anjali Udasi
OpenTelemetry vs. Traditional APM Tools
Anjali Udasi

The Anatomy of a Modern Observability System
Anjali Udasi

Redacting Sensitive Data in OpenTelemetry Collector
Anjali Udasi

Advanced OpenTelemetry: Sampling, Filtering, and Enrichment
Anjali Udasi

Observability vs. Telemetry vs. Monitoring
Anjali Udasi
Convert OpenTelemetry Traces to Metrics with SpanMetrics
Prathamesh Sonpatki

Think Data Warehouse, NOT Database.
Aniket Rao

What is the OpenTelemetry Collector and How Does It Work?
Prathamesh Sonpatki

Whitespace in OTLP headers and OpenTelemetry Python SDK
Prathamesh Sonpatki

The most important aspect of software monitoring
Aniket Rao

Prometheus Toolkit: Your Essential Companion for Monitoring
Sahil Khan

Building Monitoring with Auto-Discovery for 70+ Microservices
Preeti Dewani

What needs to change in software monitoring?
Aniket Rao
How We Cut Monitoring Costs and Deprecated Thanos at Replit
Prathamesh Sonpatki

Back to the Future: The R-C-A of alerting
Aditya Godbole
Launching Alert Studio
Aditya Godbole

Everything in software monitoring is dead, apparently
Aniket Rao

Software Monitoring — Stuck in the 00s
Piyush Verma
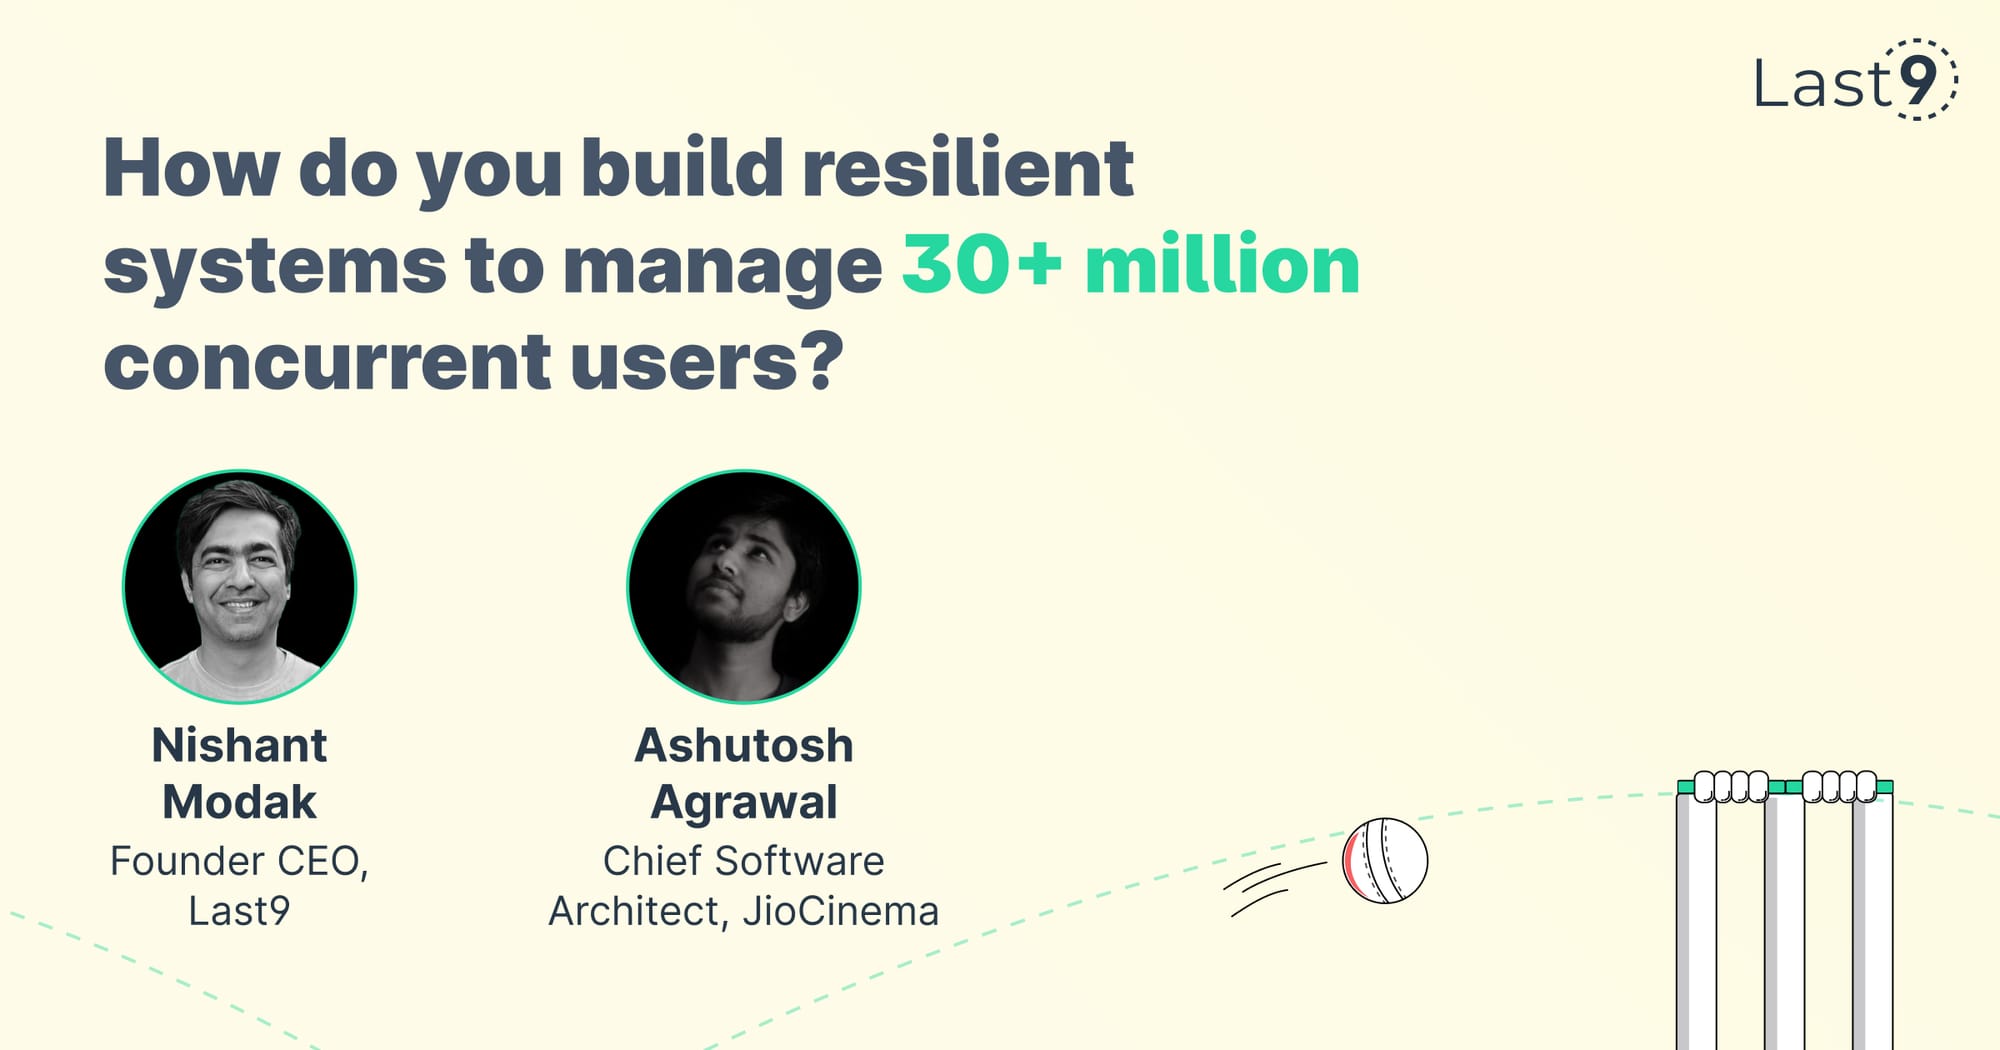
Cricket Scale e01 — Ashutosh Agrawal
Prathamesh Sonpatki

A checklist to choose a monitoring system
Prathamesh Sonpatki

Controlling Kubernetes Costs with OpenCost and Last9
Aniket Rao
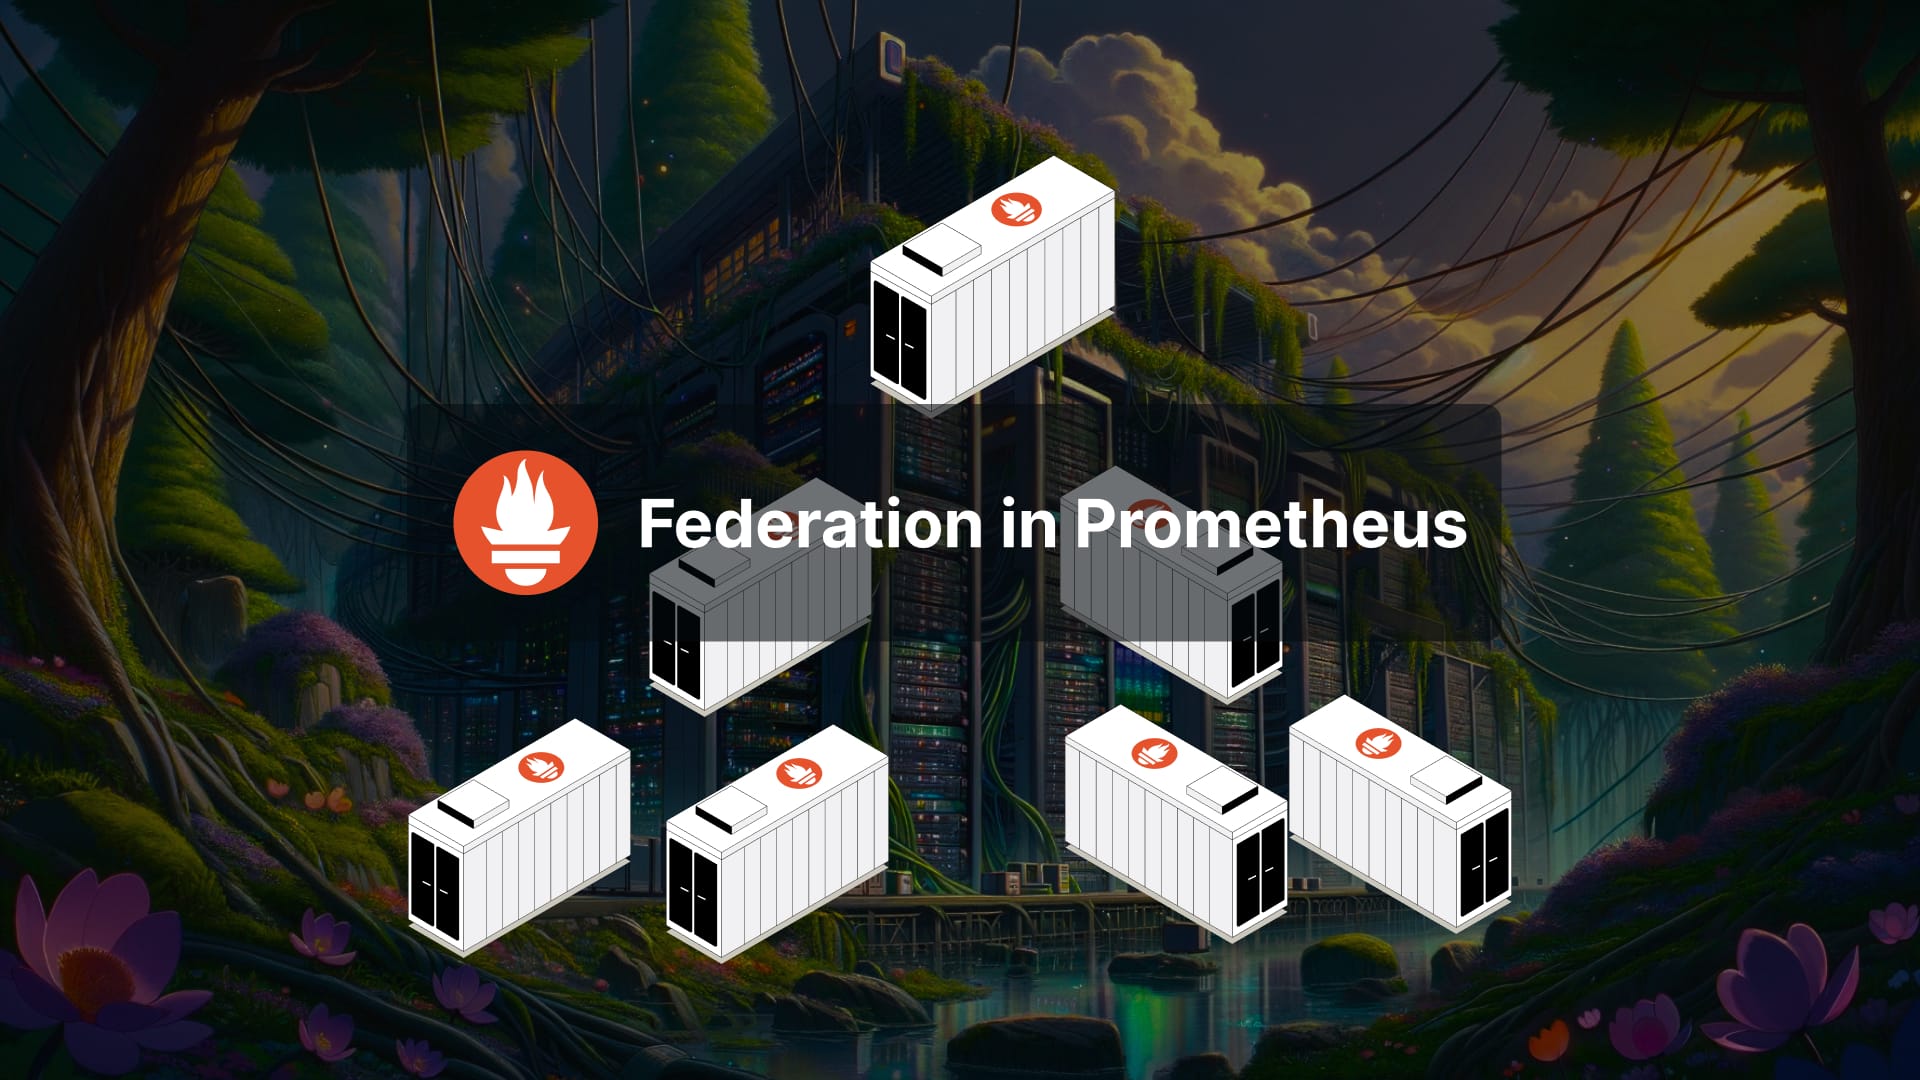
Prometheus Federation ⏤ Scaling Prometheus Guide
Tripad Mishra

Why your monitoring costs are high
Aniket Rao

The unresolved cost of High Cardinality
Prathamesh Sonpatki

Monitor Cloudflare Workers using Prometheus Exporter
Aniket Rao

Why you need a Time Series Data Warehouse
Rishi Agrawal

Instrumenting Java Apps with OpenTelemetry: Guide & Tips
Last9

Instrumenting Golang Apps with OpenTelemetry
Last9

Building Logs to Metrics pipelines with Vector
Aniket Rao

SaaS Monitoring with Levitate
Prathamesh Sonpatki

Troubleshooting Common Prometheus Issues: Cardinality & More
Last9

OpenTelemetry vs. OpenCensus
Last9

Downsampling & Aggregating Metrics in Prometheus
Last9

Software Observability from the Lens of Radar and a Black Box
Nishant Modak

Mastering Prometheus Relabeling: A Comprehensive Guide
Last9
Real-Time Canary Deployment Tracking with Argo CD & Last9
Preeti Dewani
Monitor Google Cloud Functions using Pushgateway and Levitate
Aniket Rao

Challenges with Running Prometheus at Scale
Last9

Prometheus vs. ELK
Last9

What is Thanos and How Does it Scale Prometheus?
Last9

Golang Concurrency Masterclass by Swati Modi at Gophercon 2023
Last9

OpenTelemetry vs OpenTracing: What's the Difference?
Prathamesh Sonpatki

Do more with your metrics by Piyush Verma
Last9

Unwiring High Cardinality - SRE Day 2023
Last9
How to restart Kubernetes Pods with kubectl
Anjali Udasi

This arctic winter — time to repay your tech debt
Ajey Gore
Levitate: Last9’s Managed TSDB Now on AWS Marketplace
Prathamesh Sonpatki

PromQL Macros in Levitate
Prathamesh Sonpatki
GCP Managed Service For Prometheus vs. Levitate
Prathamesh Sonpatki

A case for Observability outside engineering teams
Aniket Rao

Understanding the Rasmussen model for failures
Nishant Modak

How we tame High Cardinality by Sharding a stream
Piyush Verma

Thanos vs. VictoriaMetrics
Last9

1979, a nuclear accident and SRE
Aniket Rao

Ingest OpenTelemetry metrics with Prometheus natively
Prathamesh Sonpatki

How we tame high cardinality in time series databases
Piyush Verma, Swati Modi
InfluxDB vs. Thanos
Prathamesh Sonpatki

What Site Reliability Engineering Needs: A Swarm of Bees
Aniket Rao
Prometheus vs. VictoriaMetrics (VM)
Last9
Prometheus vs. Cortex
Last9

Take back control of your Monitoring
Nishant Modak

Graphite vs Prometheus
Prathamesh Sonpatki

SRECon APAC 2023 Recap
Aniket Rao

QCon New York 2023 Recap
Prathamesh Sonpatki
Prometheus vs Thanos: Key Differences & Best Practices
Last9

How to Manage High Cardinality Metrics in Prometheus
Last9

Prometheus vs. Grafana: How They Work Together
Prathamesh Sonpatki

Observability is a practice, not a job
Aniket Rao

Metrics, Events, Logs, and Traces: Observability Essentials
Prathamesh Sonpatki

SRE vs Platform Engineering
Last9
Prometheus vs Datadog
Last9

Using a Golang package in Python using Gopy
Arjun Mahishi

SRE vs DevOps: Definition, Key Differences, and Similarities
Last9

Filtering Metrics by Labels in OpenTelemetry Collector
Prathamesh Sonpatki

Who should define Reliability — Engineering, or Product?
Piyush Verma

What do self-driving cars tell us about Site Reliability Engineering?
Mohan Dutt Parashar
Observability—OSS vs Paid vs Managed OSS
Satyajeet Jadhav
Learnings integrating jmxtrans
Saurabh Hirani

MTTF vs MTBF vs MTTD vs MTTR
Last9

The neglected tech arctic winter — Internal SaaS expenses
Nishant Modak

Recap of SRECon Americas 2023
Last9

Understanding “Cricket Scale”
Aniket Rao

What is MTBI?
Last9

Reliability Engineering for Dummies: ELI5
Mohan Dutt Parashar

SLA vs SLO vs SLI - What's the difference
Last9
Rethinking Anomaly Detection: Focus on business outcomes
Sanjay Singh

Interesting talks on Observability from Fosdem 2023
Prathamesh Sonpatki
Comparing Popular Service Mesh Offerings
Last9

Prometheus Monitoring
Last9
Observability is dead, long live observability
Aniket Rao
When should I start thinking of observability?
Piyush Verma
A practical guide for implementing SLO
Prathamesh Sonpatki, Saurabh Hirani
Introducing Levitate: Uplift Your Metrics Management
Nishant Modak

Self-managed Prometheus vs Managed Prometheus
Last9
The importance of structured communication in the world of SRE
Saurabh Hirani
Best Practices Using and Writing Prometheus Exporters
Last9
The difference between DevOps, SRE, and Platform Engineering
Prathamesh Sonpatki
Thanos vs Cortex
Sahil Khan
Introduction to DORA Metrics
Prathamesh Sonpatki
Golang's Stringer tool
Arjun Mahishi
How to improve Prometheus remote write performance at scale
Saurabh Hirani
Prometheus vs InfluxDB: Side-by-Side Comparison
Anjali Udasi
India vs Pakistan: SRE and the Shannon Limit
Satyajeet Jadhav
Battling Alert Fatigue
Last9
SLOs, SLIs, and SLAs: Understanding Key Service Metrics
Last9

Kubernetes Monitoring with Prometheus and Grafana
Last9
Why We Auto-Delete Slack Messages at Last9
Nishant Modak
Static Threshold vs. Dynamic Threshold Alerting
Last9
Why MTTR should be a ‘business’ metric
Sidu Ponnappa
Observability - That Last 9
Akash Saxena
How we won Dukaan over
Aniket Rao

Sample vs Metrics vs Cardinality
Piyush Verma
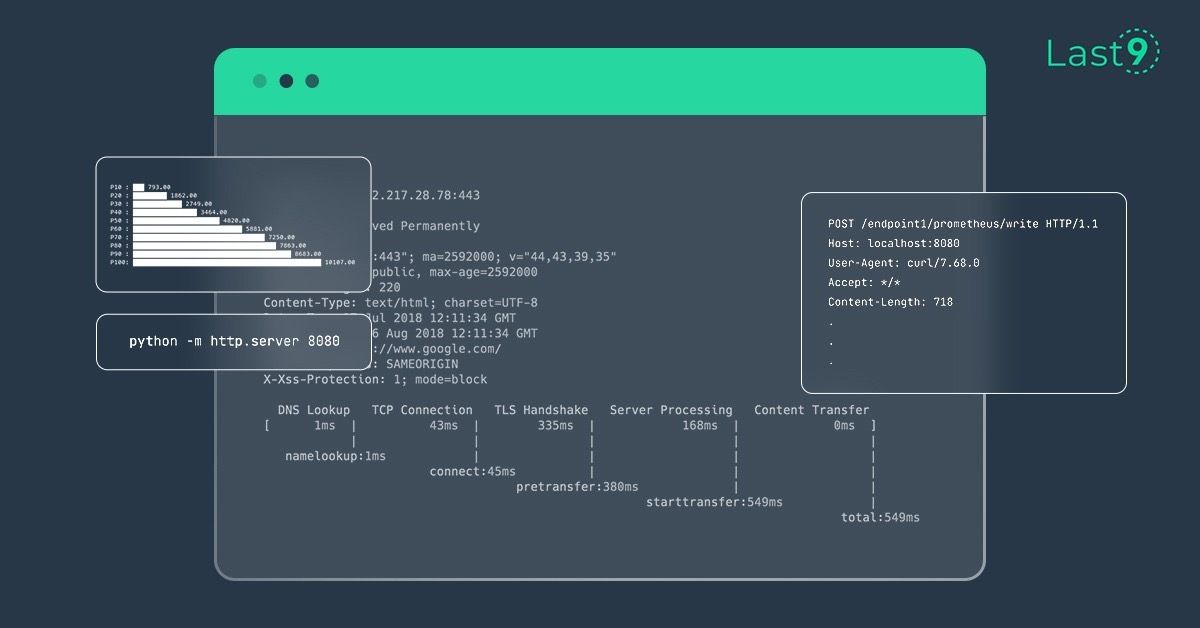
How to calculate HTTP content-length metrics on cli
Saurabh Hirani
Last9 completes SOC II Type 2 Certification
Abhi Puranam

Comparing Popular Time Series Databases
Abhi Puranam

Reliability Tools
Abhi Puranam

Latency is the new downtime
Sahil Khan
We’ve raised a $11M Series A led by Sequoia Capital India!
Nishant Modak

Why Service Level Objectives?
Piyush Verma

How to Improve On-Call Experience!
Prathamesh Sonpatki

Best Practices for Postmortems: A guide
Prathamesh Sonpatki

Choosing Effective SLIs
Akshay Chugh

The origin of Service Level Objectives
Akshay Chugh, Piyush Verma

Running a Database on EC2 is Slowing It Down
Jayesh Bapu Ahire, Akshay Chugh

Deployment Readiness Checklists
Prathamesh Sonpatki

The most interesting talks from SRECon 2021!
Akshay Chugh

Doing SRE the Right Way!
Piyush Verma

Getting the big picture with Log Analysis
Jayesh Bapu Ahire

Microservices - Tracking Dependencies
Akshay Chugh, Jayesh Bapu Ahire

SLOs eased
Piyush Verma, Saurabh Hirani

Latency SLO
Piyush Verma

SLOs: Impact on Development, Culture, and Performance
Akshat Goyal
Monorepos - The Good, Bad, and Ugly
Prathamesh Sonpatki

Components in Designing Effective SLOs
Akshat Goyal
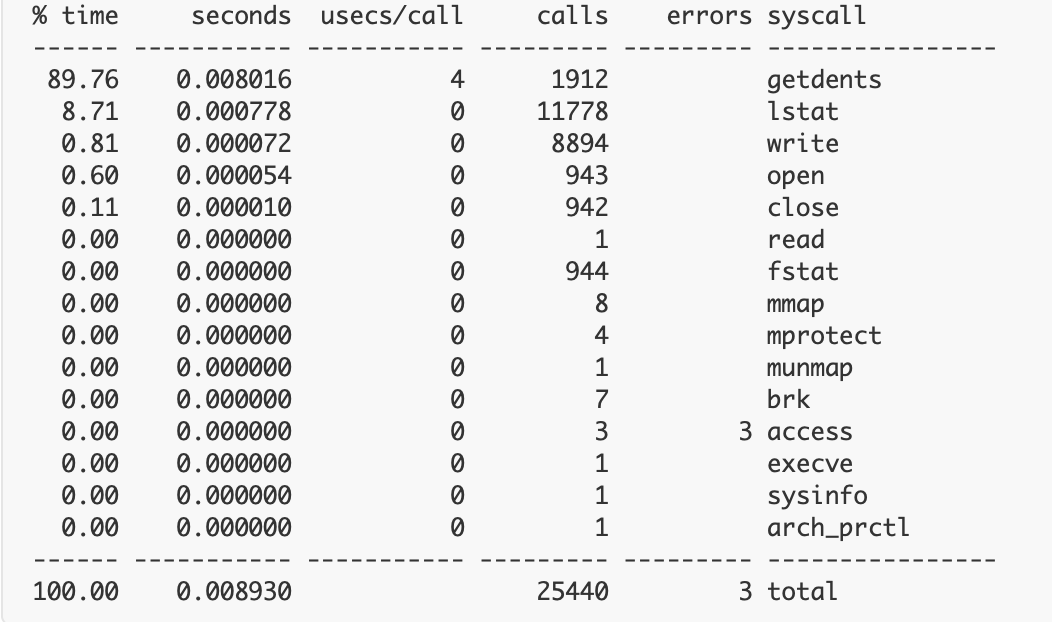
Strace – A Hidden Superpower
Akshat Goyal, Prathamesh Sonpatki

Saturation SLO: What It Is and Why You Should Consider It
Akshat Goyal

Sleep Friendly Alerting
Akshat Goyal
Services; not Server
Nishant Modak, Piyush Verma

Systems Observability
Nishant Modak, Piyush Verma

AWS security groups: canned answers and exploratory questions
Saurabh Hirani

If it ain't broke...
Saurabh Hirani

mv aws-security-group shoot-foot
Saurabh Hirani

Rescuing a SPAghetti React project
Prathamesh Sonpatki

One year at Last9
Prathamesh Sonpatki
Much That We Have Gotten Wrong About SRE
Piyush Verma

Infrastructure-As-Code-As-Software
Piyush Verma
SLOs That Lie
Piyush Verma

Latency Percentiles are Incorrect P99 of the Times
Piyush Verma
SRE Tooling – the Clever Hans fallacy
Piyush Verma

Root Cause Analysis For Reliability: A Case Study
Piyush Verma